Bitcoin dominance nears key resistance – Will altcoins catch a break?

July 21, 2025 Update – Bitcoin Dominance Drops, Altcoins Start to Move
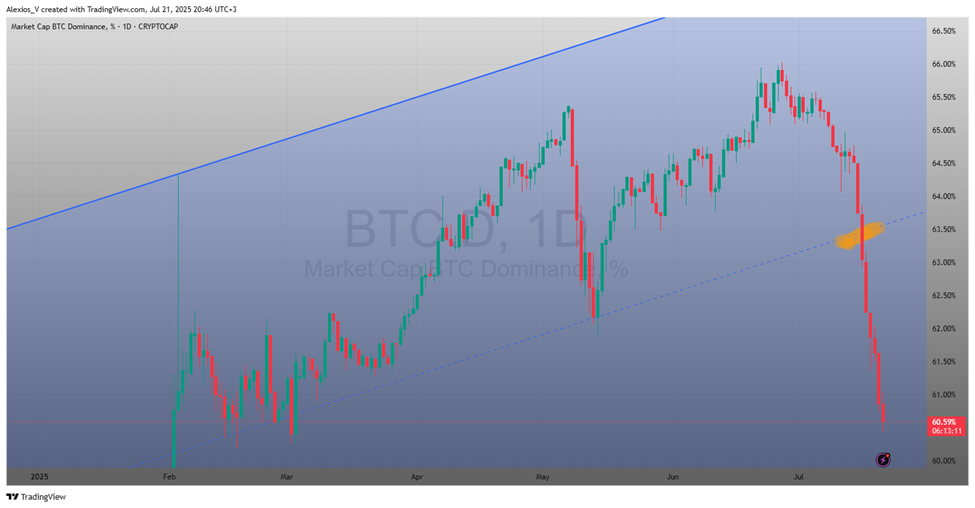
The bitcoin dominance chart just posted its sharpest single day drop in three years. Dominance fell from the mid, 60% range toward the 60% level, even as Bitcoin reached new all, time highs between $118,000–123,000. This unusual mix, rising BTC price and falling dominance, suggests that many traders are taking profits and rotating funds into altcoins.
As Bitcoin stays stable near its highs, capital is clearly flowing into the altcoin market. Ethereum led with a weekly gain of around 24%, and several mid, cap cryptocurrencies are showing strong bullish patterns. The total altcoin market cap also broke through key resistance levels, signaling growing momentum across the cryptocurrency market.
What to Watch This Week:
- Capital Rotation Into Altcoins
Falling BTC dominance during a sideways Bitcoin trend is often the first sign of altseason. The dip into the 60% range opens the door for a broader move. - Bitcoin’s Behavior
Bitcoin holding above its all, time highs while dominance slides shows that it is not absorbing capital, but simply holding it. That gives room for altcoins to move. - Altcoin Momentum
Ethereum is breaking out of long term downtrends, and several key altcoins are pushing higher. Chart setups across the total crypto market suggest further upside.
Trader’s Strategy Snapshot:
|
Condition |
Potential Move |
|
BTC.D holds near 60% |
Long altcoins with strong momentum (ETH, XRP, mid, caps) |
|
BTC.D rebounds toward 64–65% |
Lock in gains or tighten stops on alt positions |
|
BTC price consolidates at ATH |
Ideal setup for altcoin runs |
|
BTC.D continues sliding |
Consider scaling further into alt positions |
The following has been published on July 14:
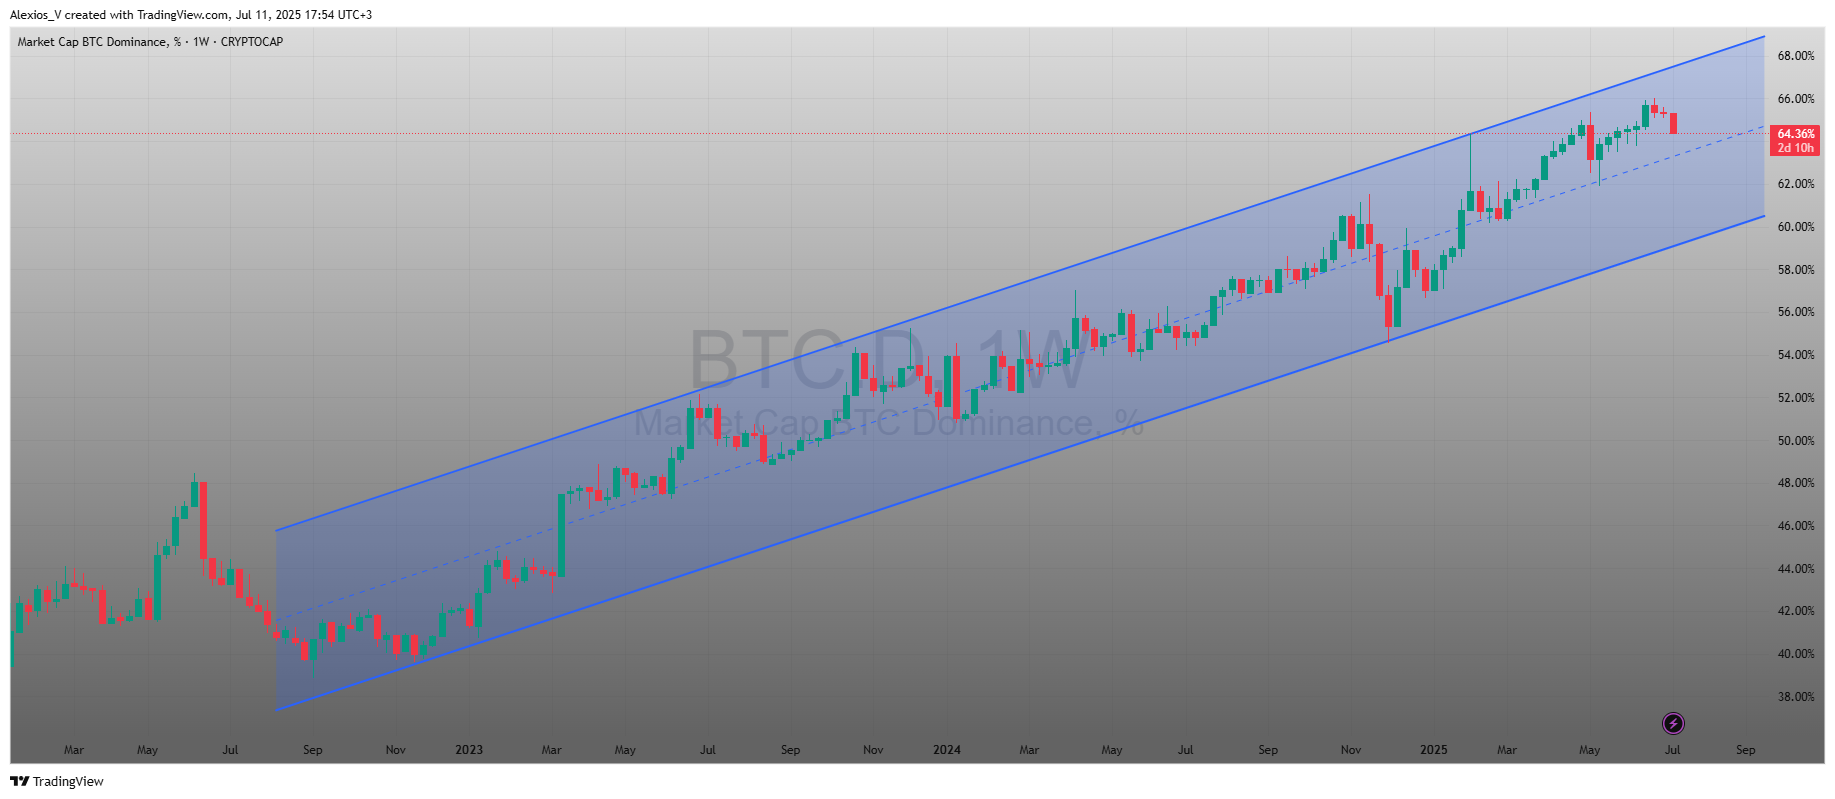
The Bitcoin dominance chart has been following a clear pattern for nearly two years. Now, with dominance reaching around 64.58%, it is testing a level that has rejected many previous moves. This moment could shape what happens next in the crypto market.
For those unfamiliar with the term, Bitcoin dominance measures how much of the total crypto market value comes from Bitcoin alone. In simple words, it shows Bitcoin’s market share compared to all other altcoins. When this percentage goes up, Bitcoin gains strength in the cryptocurrency market. When it drops, altcoins usually perform better.
Traders often follow the Bitcoin dominance tradingview chart (BTC.D) to get a sense of where capital is moving. Right now, the chart is sending an important signal.
A look at the Bitcoin dominance channel
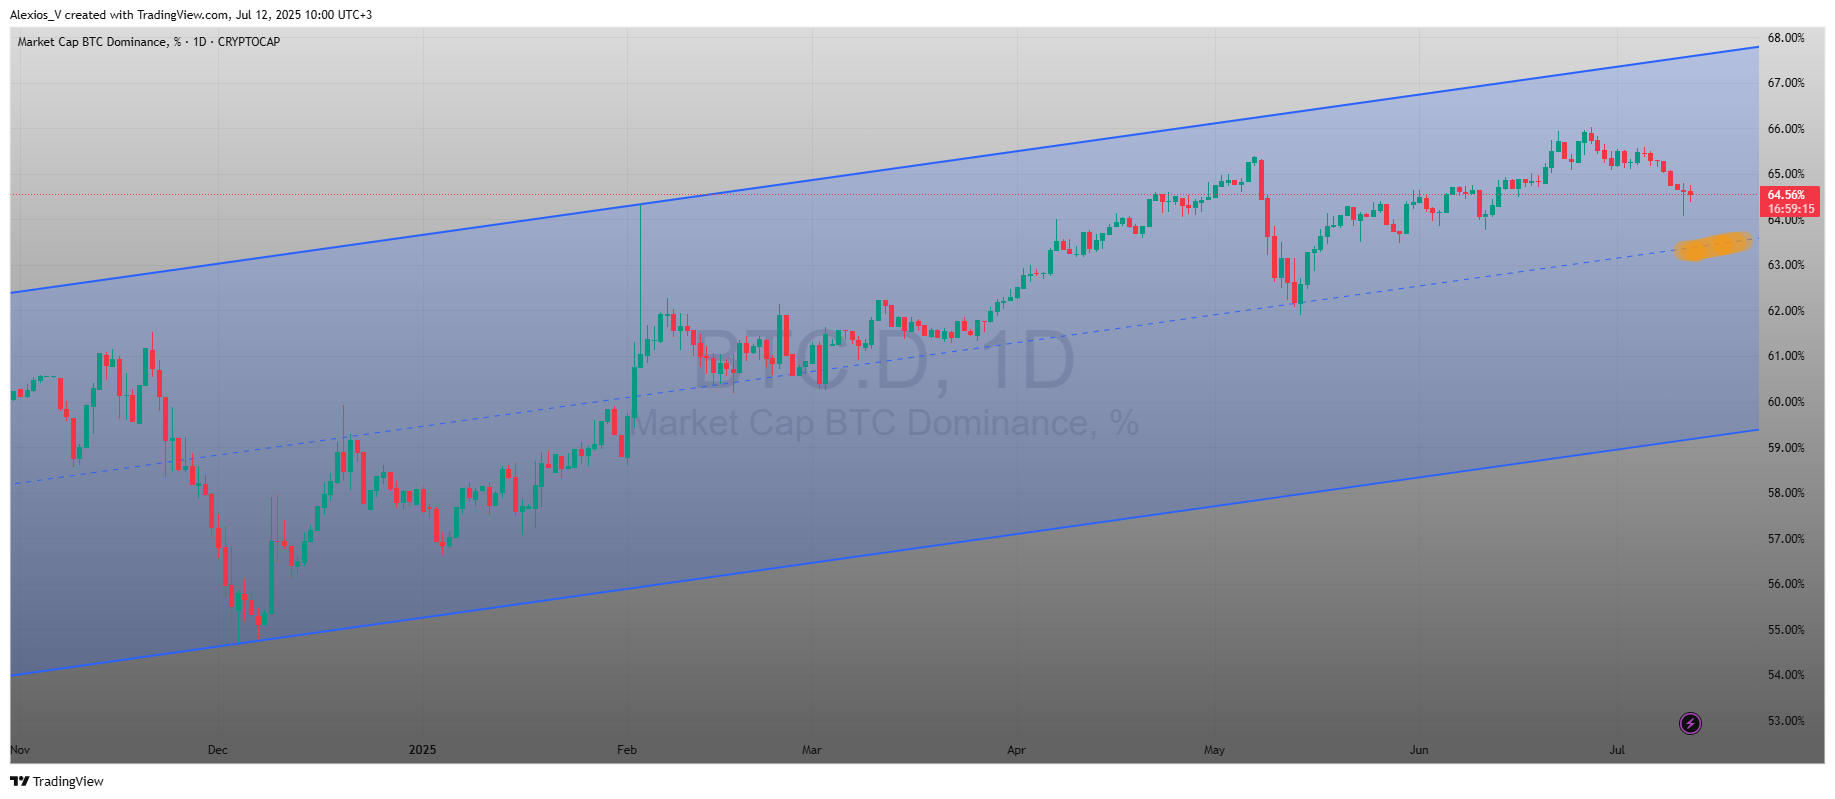
Since early 2023, Bitcoin dominance has been moving inside a steady ascending channel. This means the trend has been climbing, with price bouncing between two rising lines — support on the bottom and resistance on the top.
Every time dominance touched the lower side of the channel, it found buyers. Every time it reached the top, it lost momentum. This pattern has repeated many times. And now, the chart is again testing the top boundary near 64.58%.
This resistance area has a history. In the past, dominance failed to break above it and turned lower. If that happens again, it could open the door for a shift in capital back to altcoins — a moment many traders call alt season.
What Bitcoin dominance tells us about the crypto market
When dominance rises, it usually means Bitcoin is taking in more value compared to other coins. That can happen for many reasons — fear in the market, major BTC news, or weak altcoin performance. But there is always a limit.
A high dominance level, like the one we see now, often creates pressure in the system. Investors may start taking profit from Bitcoin and move back into altcoins, especially if BTC
shows signs of slowing down. This shift in behavior can change the look of the total market capitalization.
In simple terms, when Bitcoin stops growing faster than everything else, smaller cryptocurrencies have more room to move. That is why many watch this chart closely.
Two scenarios to watch
This moment presents two possible outcomes. Both could bring strong moves across the cryptocurrency market.
1. Rejection from resistance
If Bitcoin dominance fails to break above the 64.6%–65% level, it might fall back toward the middle or even the lower end of the channel. That could mean a drop to the 55%–58% area.
Such a decline would likely come with stronger interest in altcoins. Funds might rotate out of Bitcoin and into high-risk tokens, DeFi coins, and other Layer 1 or Layer 2 projects. In short, this could be the start of alt season, a period when altcoins outperform Bitcoin for weeks or even months.
This scenario would also signal that Bitcoin has reached a short-term peak in relative strength, at least for now. The total crypto market might grow more evenly, rather than being led by BTC alone.
2. Breakout above the channel
If Bitcoin dominance pushes through the resistance and closes above 66% with strong momentum, that could signal a deeper shift. This breakout would show that Bitcoin is not just leading the market — it is starting to take over completely.
In this case, Bitcoin market cap could rise even faster, pulling value away from almost every altcoin category. The btc dominance chart would move into new territory, breaking away from the rising channel that has held for nearly two years.
Such a breakout could also mean altcoins face more weakness ahead. Traders may continue to prefer Bitcoin for its relative safety, especially during uncertain market conditions.
What would invalidate the pattern?
Patterns do not last forever. Two situations could break this channel’s meaning:
- A strong breakout above 66% dominance that stays above for many days or weeks. That would mean the channel no longer controls price movement.
- A sharp breakdown below the lower trendline (around 58%) would mean the uptrend is over, and Bitcoin is losing its grip on the total market.
Both cases would change the structure of the market and affect portfolio strategies.
Why this chart matters now
The Bitcoin dominance tradingview chart has been one of the most useful tools for spotting turning points in the crypto market. It does not show prices of coins directly, but it shows where the money is going.
Right now, Bitcoin dominance is at a key resistance level. If the past is any guide, this could be an area where altcoins wake up. But if dominance breaks higher, Bitcoin could pull even more capital, changing how investors approach the market in 2025.
Keep an eye on this chart. Whether tracking select market data, market cap shifts, or the overall cryptocurrency market, this is one of the best signals for understanding the next big move.
Bitcoin dominance chart today
As of today, the Bitcoin dominance chart briefly touched 65.42%, attempting to break higher but triggering a sell-off in the altcoin market. Bitcoin itself stayed relatively stable, while capital rotated into smaller coins. What stands out now is the midline of the rising channel. This level, which once acted as both support and resistance, could become a turning point again. If dominance bounces off the midline and heads lower, toward 60%, altcoins may see renewed momentum. For now, as long as Bitcoin stays above key trend lines, confidence remains strong among bulls, and the crypto market could lean toward further altcoin growth.
And remember, this article is for informational purposes only. Always do your own research and never invest more than you can afford to lose.
Author

Alexios Valonasis
SocialFire
Alexios Valonasis is an SEO Specialist and Web3 content strategist with over 6 years of experience in crypto marketing and more than 15 years in IT operations. He has led technical SEO, audits and content growth projects in the blockchain space.


