Binance Coin Price Update: Why BNB/USD triangle breakout stalled under $16?
- Binance Coin recovery fizzles out at $16 amid the tightening bearish grip.
- The RSI movement towards 70 coupled with the right bullish volume could push BNB above $20.

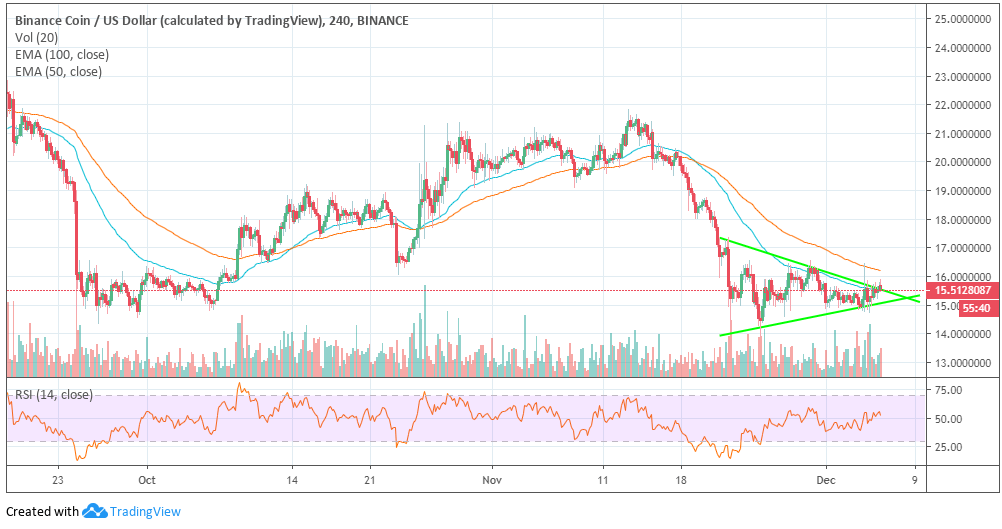
Binance Coin recovery in November came close to $22 after breaking the resistance at $20. However, the impressive performance culminated in losses owing to the bearish market across the board over the last two weeks. The declines tested $14 to the south, giving way for the ongoing reversal.
The price is doddering at $15.50 and supported by the short-term EMA 50 on the 4-hour chart. The immediate upside is capped by the $16 crucial resistance. At the same time, the EMA 100 is hindering movement at $16.20.
The last week has seen BNB form a lower high and a higher low pattern. This created a short term symmetrical triangle. A break above the triangle resistance still struggles with the resistance at $16 in spite of the RSI movement above $50.
The volume is expanding but still is bearish, which means the sellers have the upper hand. The RSI has to continue moving upwards towards 70 to ensure that bullish interest stays intact as BNB focuses on assaulting the $20 hurdle.
BNB/USD 4-hour chart
Author

John Isige
FXStreet
John Isige is a seasoned cryptocurrency journalist and markets analyst committed to delivering high-quality, actionable insights tailored to traders, investors, and crypto enthusiasts. He enjoys deep dives into emerging Web3 tren


