|

Bitcoin Chart Analysis: BTC/USD slides deeper inside a triangle pattern – Confluence Detector

  • On a daily chart, BTC/USD moves down from an upper line of a triangle pattern.
  • The intraday charts reflect growing market indecision. 

Bitcoin tested the upper line of the recent triangle pattern during the weekend, but the upside momentum was not strong enough to take the price above the critical resistance. At the time of writing, BTC/USD is changing hands at $9,530, mostly unchanged both on a day-to-day basis and since the beginning of Monday. The intraday high is registered at $9,612, while the low is reached at $9,446. The first digital coin is moving within the short-term bullish trend amid low volatility

BTC/USD daily chart

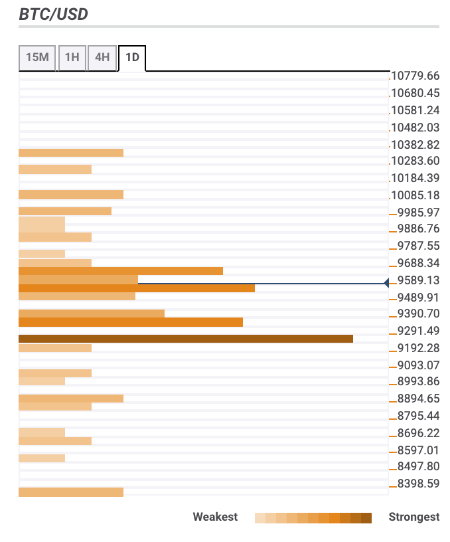
On the intraday chart, BTC/USD is hovering around 1-hour SMA50 amid growing market indecision, which is also confirmed by a flat RSI. The current conditions imply that the price may stay range-bound during the next trading hours. Let’s have a closer look at the strong resistance and support levels to get a clear view of the technical picture.

BTC/USD 1-hour chart

Resistance levels

$9,600 – 23.6% Fibo retracement monthly, the highest level of the previous week
$10,000 – Pivot Point 1-day Resistance 3, the upper line of the daily Bollinger Band, the highest level of the previous month
$10,300 - Pivot Point 1-month Resistance

Support levels

$9,500 – 38.2% Fibo retracement daily, the middle  line of the 4-hour Bollinger Band, the middle line of the 1-hour Bollinger Band
$9,200 – 4-hour SMA50, 1-hour SMA200, 38.2% Fibo retracement weekly
$9,000 – 61.8.6% Fibo retracement weekly.


fxsoriginal

Author

Tanya Abrosimova

Tanya Abrosimova

Independent Analyst


More from Tanya Abrosimova
Share:

Markets move fast. We move first.

Orange Juice Newsletter brings you expert driven insights - not headlines. Every day on your inbox.

By subscribing you agree to our Terms and conditions.

Editor's Picks

BNB Price Forecast: BNB slips below $855 as bearish on-chain signals and momentum indicators turn negative

BNB, formerly known as Binance Coin, continues to trade down around $855 at the time of writing on Tuesday, after a slight decline the previous day. Bearish sentiment further strengthens as BNB’s on-chain and derivatives data show rising retail activity.

Top Crypto Losers: Aster, Midnight, and Ethena extend losses as selling pressure mounts

Aster, Midnight, and Ethena are the altcoins with the most losses over the last 24 hours, as the broader cryptocurrency market weakens amid Bitcoin dropping below $86,000. ASTER, NIGHT, and ENA risk further losses as selling pressure mounts and risk-off sentiment spreads across the crypto market.

Ethereum Price Forecast: BitMine acquires 102,259 ETH as price plunges 5%

Ethereum (ETH) treasury company BitMine Immersion scaled up its digital asset stash last week after acquiring 102,259 ETH since its last update. The purchase has increased the company's holdings to 3.96 million ETH, worth about $11.82 billion at the time of publication.

Strategy scoops about $1 billion in Bitcoin for second consecutive week

Bitcoin (BTC) treasury and financial intelligence firm Strategy expanded its holdings following another round of weekly accumulation.

Orange Juice Newsletter – Smart insights by real people. Every day.

A free newsletter highlighting key market trends to help traders stay a step ahead. Daily insights on the most relevant trading topics, compiled by our experts in an easy-to-read format so you never miss an important move.

Bitcoin: Fed delivers, yet fails to impress BTC traders

Bitcoin (BTC) continues de trade within the recent consolidation phase, hovering around $92,000 at the time of writing on Friday, as investors digest the Federal Reserve’s (Fed) cautious December rate cut and its implications for risk assets.