Bitcoin Cash Technical Analysis: BCH/USD trending in an upward channel despite Monday’s bearish action
- BCH/USD has found resistance at the SMA 50 curve in the daily chart.
- BCH/USD is hovering above the Ichimoku cloud in the four-hour chart.

BCH/USD daily chart
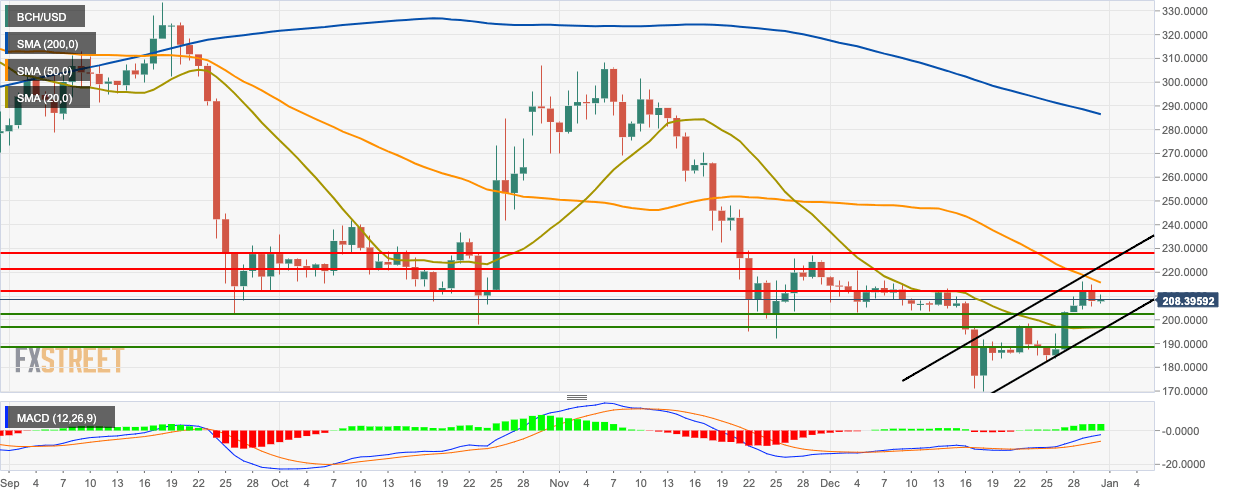
After encountering resistance at the $212.40 line, the price of BCH/USD fell to $207.90. Since then, the price has gone up by a bit to $210. The 50-day Simple Moving Average (SMA 50) curve acts as resistance to the market, while the Moving Average Convergence/Divergence (MACD) indicates increasing bullish momentum. Despite this Monday’s bearish action, BCH/USD is trending in an upwards channel formation.
BCH/USD four-hour chart
-637133643600996486.png)
The four-hour BCH/USD is hovering above the Ichimoku Indicator and the Relative Strength Index (RSI) indicator is trending around 60.95, indicating that the price can go up even more. BCH/USD has charted three straight bullish sessions and is trending in an upwards channel formation in the four-hour chart.
BCH/USD hourly chart
-637133643229741452.png)
The hourly chart is consolidating in a triangle pattern and has encountered resistance at the SMA 50 curve. The latest session managed to break above the SMA 20. The Elliott Oscillator has had a red session following six straight green sessions, indicating a reversal of bullish sentiment in the hourly timeframe.
Author

Rajarshi Mitra
Independent Analyst
Rajarshi entered the blockchain space in 2016. He is a blockchain researcher who has worked for Blockgeeks and has done research work for several ICOs. He gets regularly invited to give talks on the blockchain technology and cryptocurrencies.


