Bitcoin Cash technical analysis: BCH/USD manages a hattrick of bullish days
- BCH/USD went up from $318.35 to $325.30 in the early hours of Wednesday.
- The Elliott Oscillator has charted five bullish sessions in a row.

BCH/USD daily chart
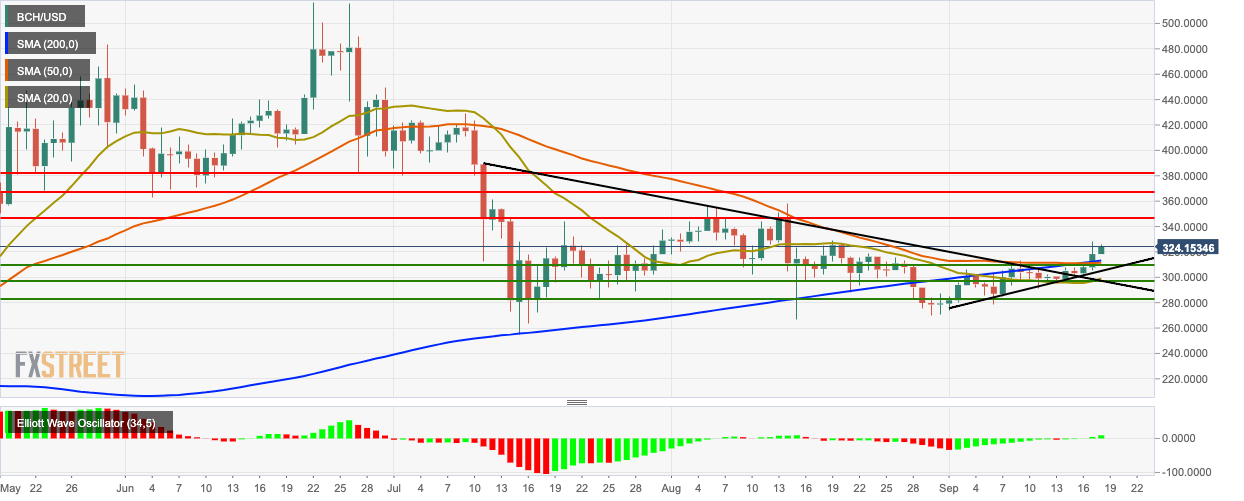
BCH/USD has managed to chart three straight bullish days in a row. Bitcoin Cash has gone up from $318.35 to $325.30 today. The market had a bullish breakout from the triangle formation and is trending above the 200-day Simple Moving Average (SMA 200), SMA 50 and SMA 20 curves. The Elliott Oscillator has charted five bullish sessions in a row.
BCH/USD four-hour chart
-637043698416994741.png)
The four-hour BCH/USD chart went up to $323.85, where it met resistance and dropped to $318.35. The bulls then re-entered the market and took the price back up to $325.30. The four-hour price is trending above the 20-day Bollinger Band, indicating that BCH/USD is currently overpriced. The Relative Strength Index (RSI) indicator has crept back into the overbought zone after exiting it.
BCH/USD hourly chart
-637043697765263836.png)
The hourly BCH/USD has found support on the upward trending line. The hourly price is also trending above the SMA 20, SMA 50 and SMA 200 curves. The Moving Average Convergence/Divergence (MACD) line was about to cross over the signal line before they both diverged and started trending parallelly to each other.
Key Levels
Author

Rajarshi Mitra
Independent Analyst
Rajarshi entered the blockchain space in 2016. He is a blockchain researcher who has worked for Blockgeeks and has done research work for several ICOs. He gets regularly invited to give talks on the blockchain technology and cryptocurrencies.


