Bitcoin Cash Technical Analysis: BCH/USD is back within the bears control
- Bitcoin Cash price was trading firmly in negative territory on Monday, down 3%
- BCH/USD has been cooling ever since the explosive run from 16-24th December. Remains vulnerable to another potential deep fall.

BCH/USD 15-minute chart
- Price action bounces off a near-term support within a descending wedge pattern.
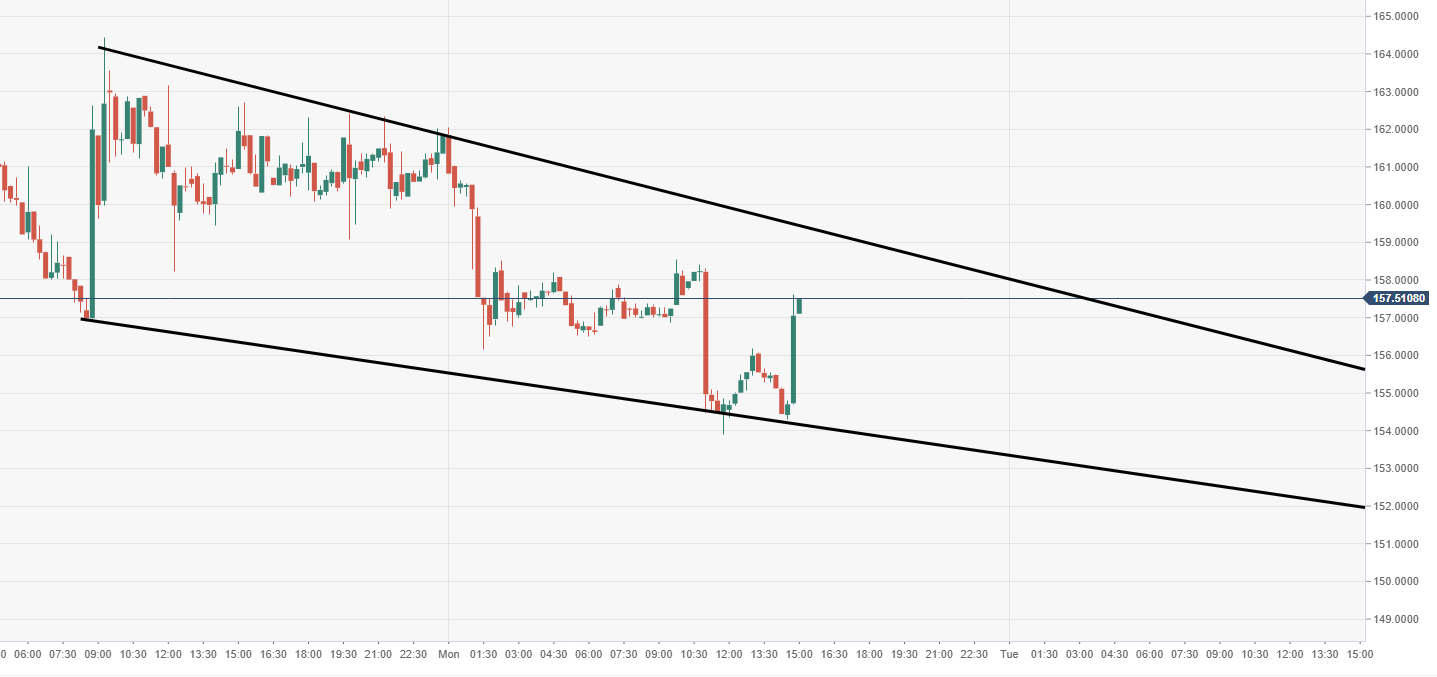
Spot rate: 157.13
Relative change: -2.51%
High: 162.04
Low: 153.91
Trend: Bearish
Support 1: 157.34, daily pivot point support.
Support 2: 152.85, daily pivot point support.
Support 3: 149.31, daily pivot point support.
Resistance 1: 165.38, daily pivot point resistance.
Resistance 2: 168.92, daily pivot point resistance.
Resistance 3: 173.41, daily pivot point resistance.
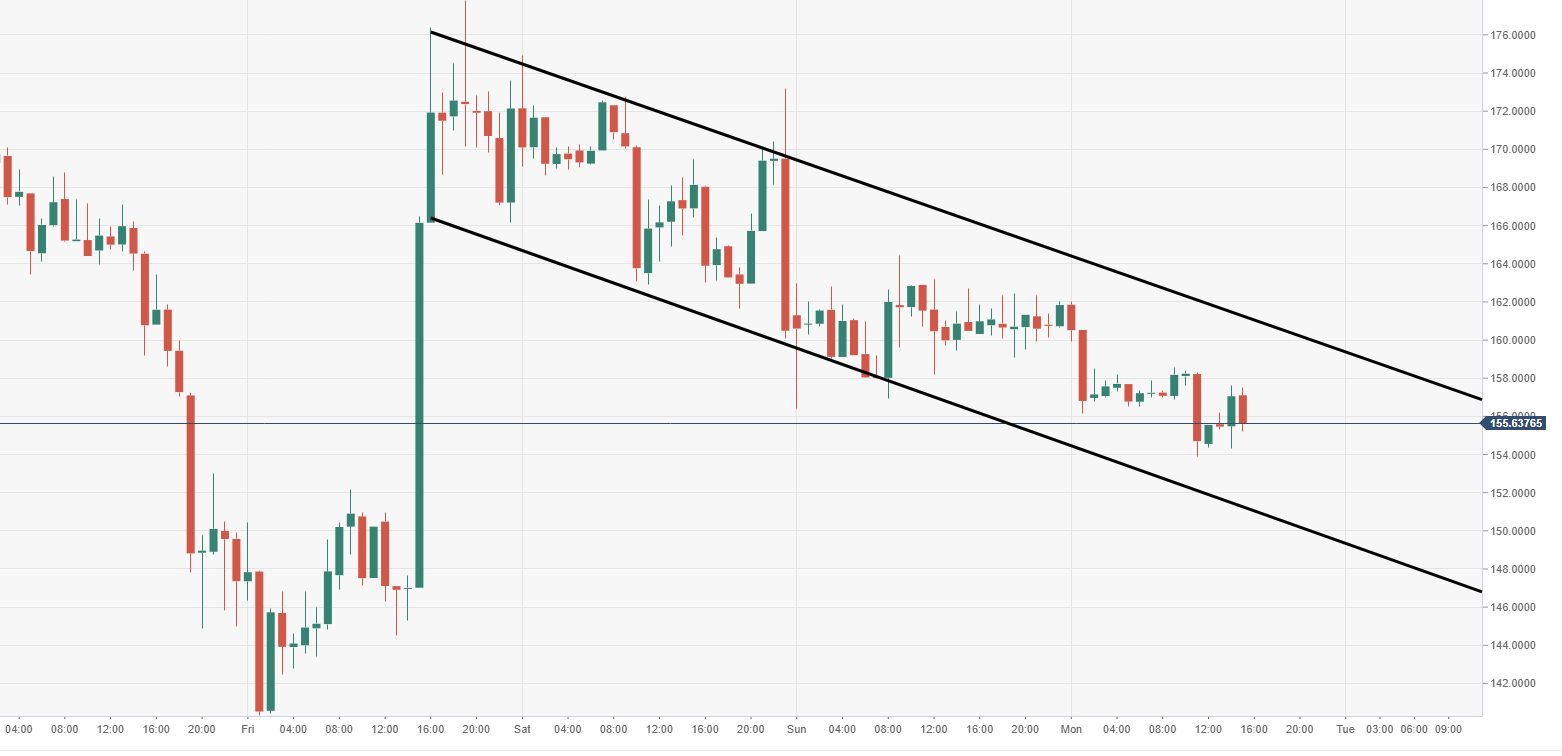
BCH/USD 60-minute chart
- Price action is moving within a steep descending channel formation.
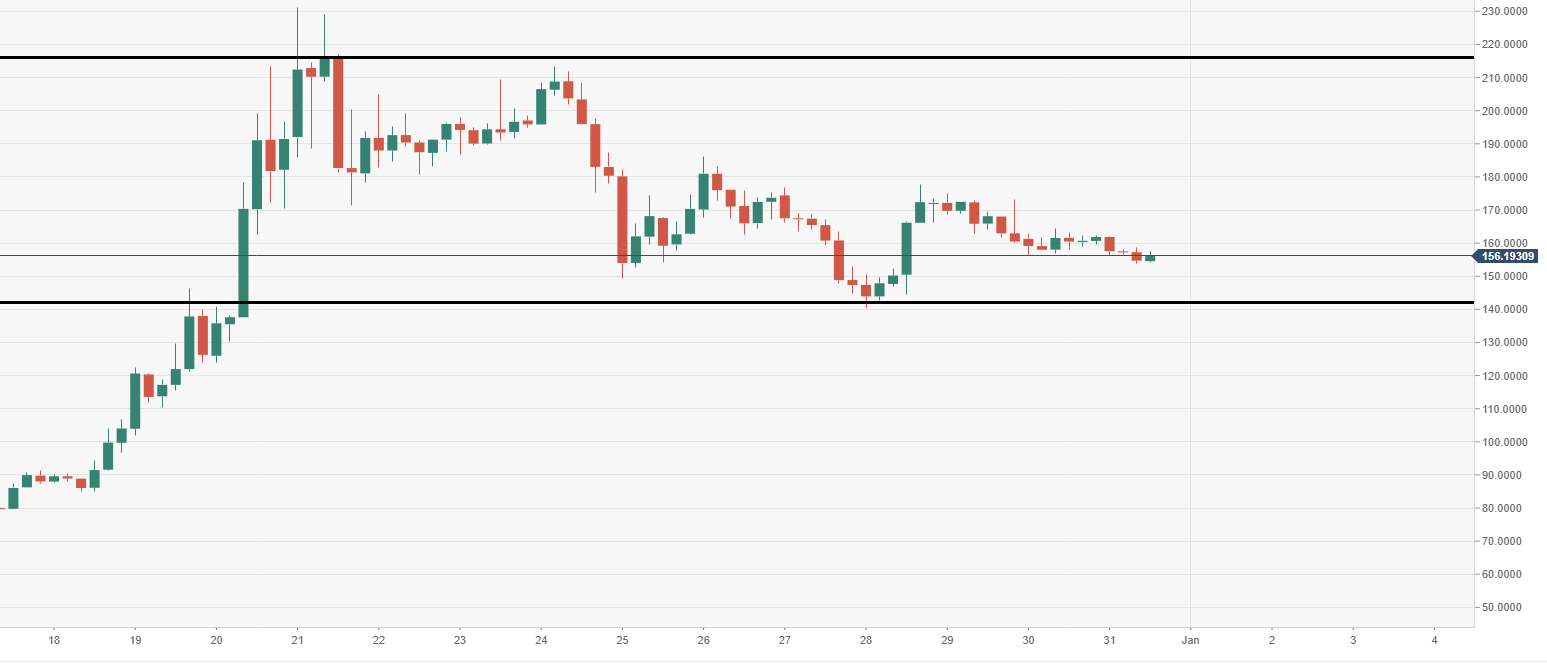
BCH/USD 4-hour chart
- BCH/USD has entered into a new trading range, post the explosive run higher mid-December.
Author

Ken Chigbo
Independent Analyst
Ken has over 8 years exposure to the financial markets. He started his career as an analyst, covering a variety of asset classes; forex, fixed income, commodities and equities.


