Bitcoin Cash Technical Analysis: BCH/USD comes crashing down after failing to breakout of triangular formation
- Bitcoin Cash price was hit hard late on Monday, nursing chunky losses of some 6.5%,
- A big rejection was seen for BCH/USD at the upper part of a triangular pattern formation.

BCH/USD 4-hour chart
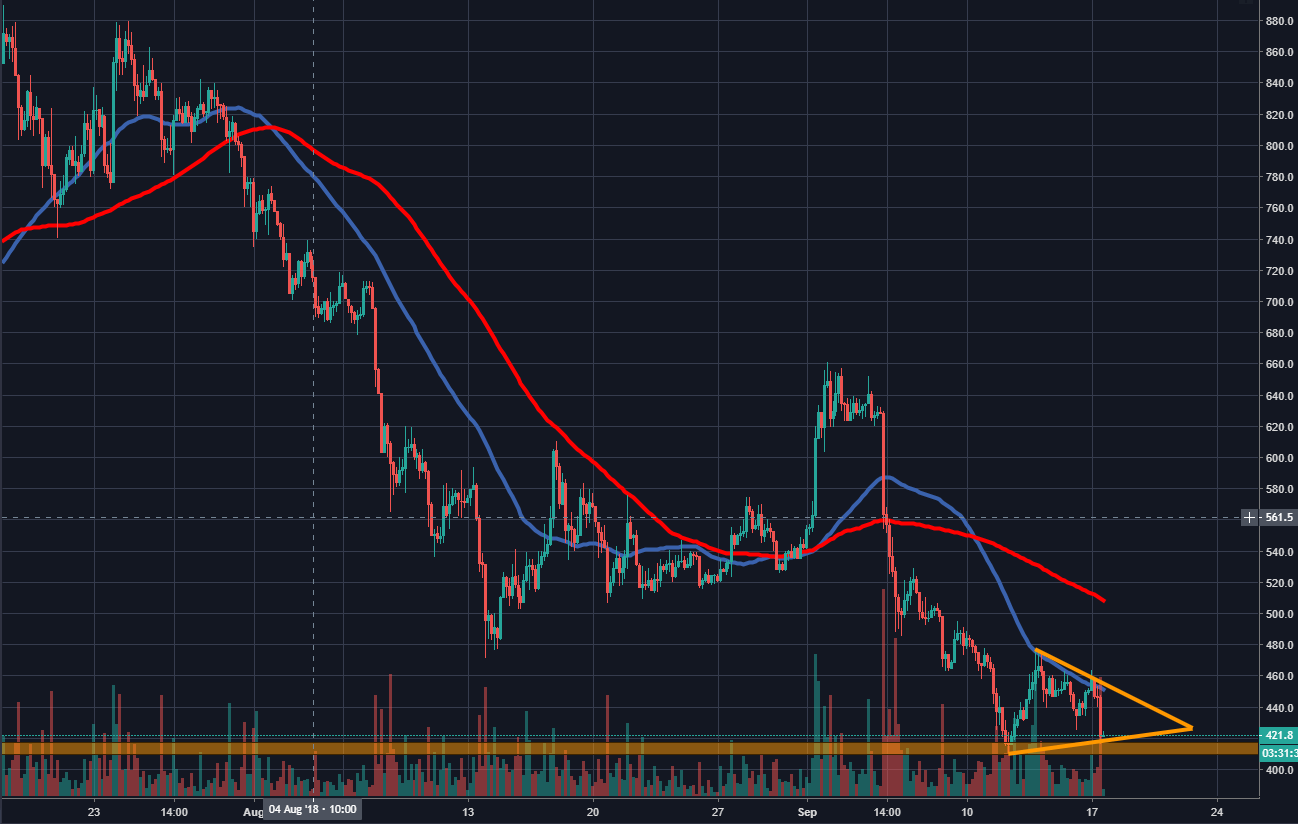
Spot rate: 421.5
Relative change: -6.45%
High: 463.4
Low: 416.1
Trend: Bearish
Support 1: 416.0, lower part of triangular pattern & demand zone.
Support 2: 410.2, 12th September low.
Support 3: 400.0, psychological support handle.
Resistance 1: 450.0, 50MA (4-hour).
Resistance 2: 456.5, upper part of triangle.
Resistance 3: 475.6, 14th September top area.
Author

Ken Chigbo
Independent Analyst
Ken has over 8 years exposure to the financial markets. He started his career as an analyst, covering a variety of asset classes; forex, fixed income, commodities and equities.
More from Ken Chigbo


