Bitcoin Cash Technical Analysis: BCH/USD bulls gunning for big wedge breakout
- Bitcoin Cash late on Tuesday was seen holding gains of over 6% for the session.
- BCH/USD bulls are set for a daily breakout and closure above a descending wedge pattern, that had been containing the price.

BCH/USD 15-minute chart
- Price action set to retest a breached descending wedge pattern formation, seen clearly on the longer time frames.
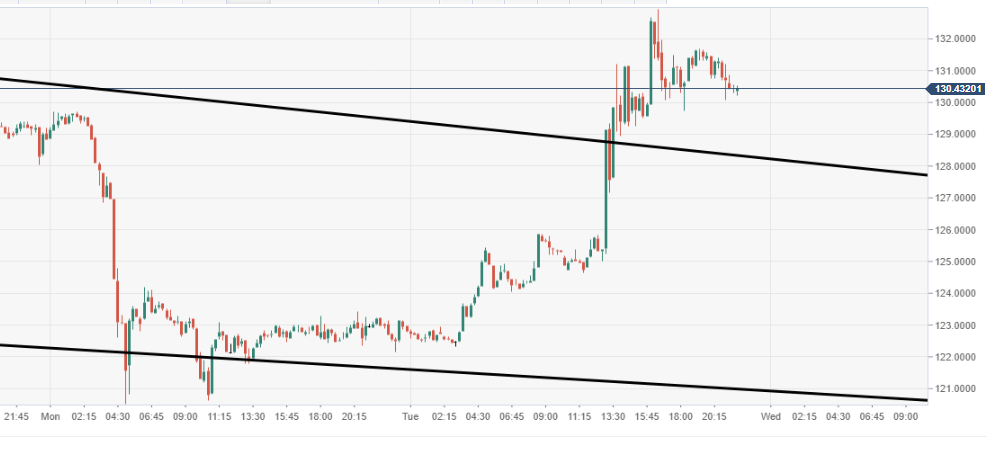
Spot rate: 130.46
Relative change: +6.15%
High: 132.94
Low: 122.32
Trend: Bullish
Trends:
Daily SMA20: 131.5892
Daily SMA50: 126.0166
Daily SMA100: 137.1975
Daily SMA200: 313.1052
Levels:
Previous Daily High: 129.7066
Previous Daily Low: 120.5261
Previous Weekly High: 156.9334
Previous Weekly Low: 125.1897
Previous Monthly High: 156.9334
Previous Monthly Low: 109.9144
Daily Fibonacci 38.2%: 124.0331
Daily Fibonacci 61.8%: 126.1997
Daily Pivot Point S1: 118.9877
Daily Pivot Point S2: 115.1666
Daily Pivot Point S3: 109.8072
Daily Pivot Point R1: 128.1682
Daily Pivot Point R2: 133.5277
Daily Pivot Point R3: 137.3487
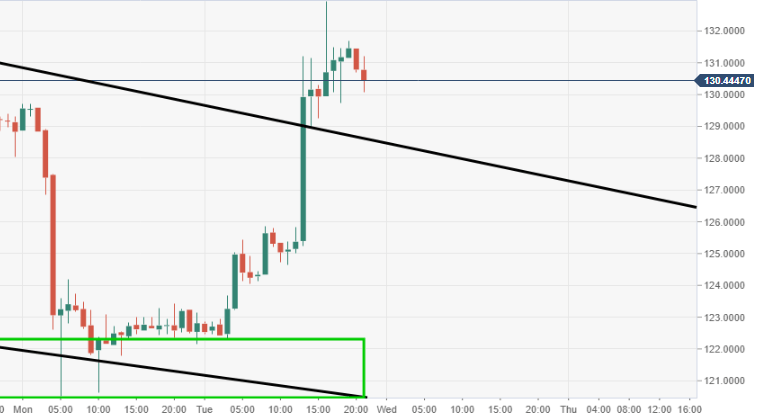
BCH/USD 60-minute chart
- Decent buying came into play around the session low area, in proximity to a lower acting trend line of a wedge observed via the daily chart.
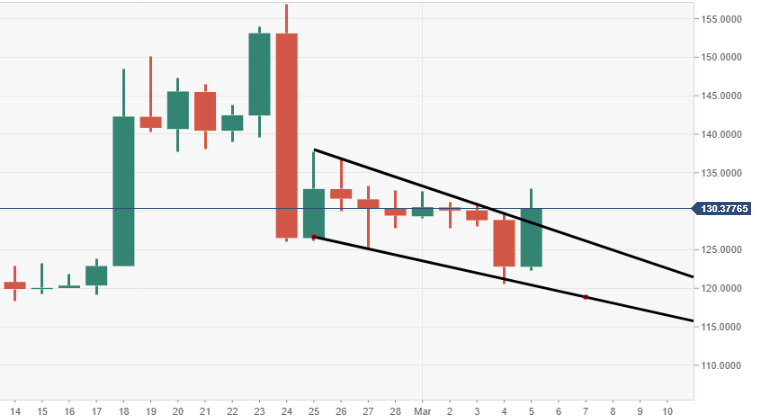
BCH/USD daily chart
- Bulls are looking to escape a descending wedge pattern formation seen via the daily chart view.
Author

Ken Chigbo
Independent Analyst
Ken has over 8 years exposure to the financial markets. He started his career as an analyst, covering a variety of asset classes; forex, fixed income, commodities and equities.


