Bitcoin Cash technical analysis: BCH/USD bullish flag or channel of death
- Bitcoin Cash price is trading in the red, down over 4% the session on Tuesday.
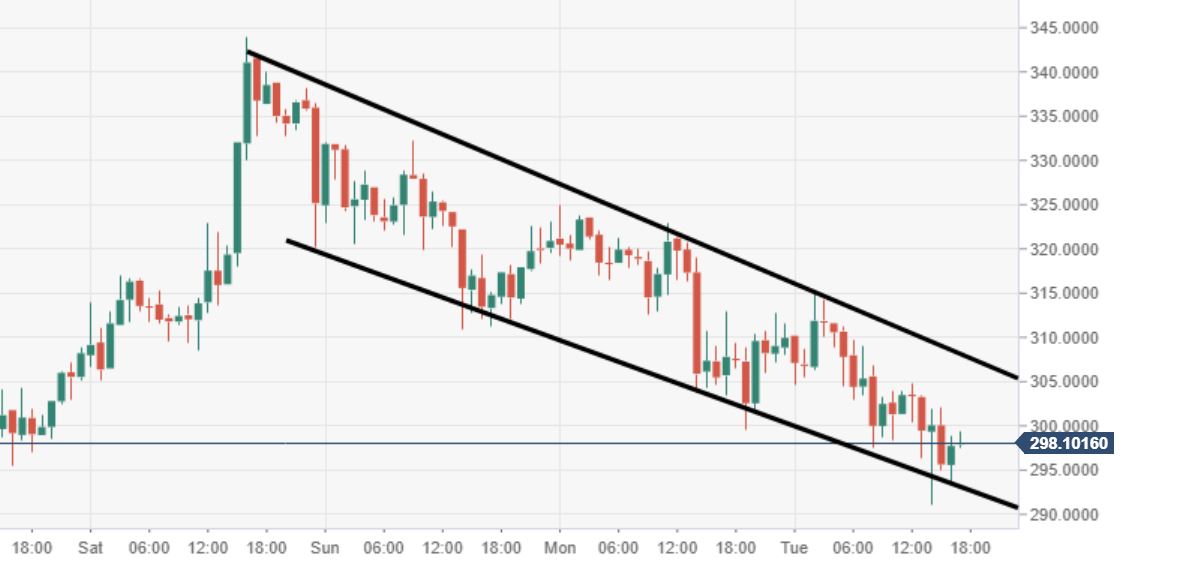
- BCH/USD price action is descending, moving within a channel structure, which can also be perceived as a bullish flag.
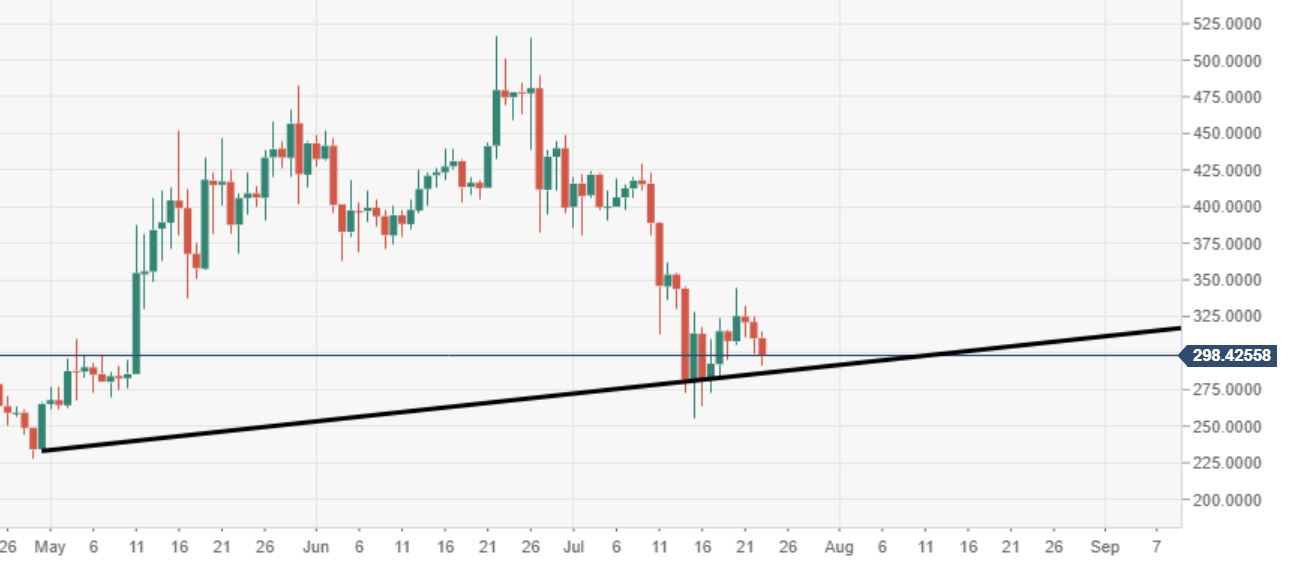
- The price is trading ever so close to a critical ascending trend line of support.

Spot rate: 298.51
Relative change: -4.10%
High: 315.14
Low: 291.04
BCH/USD 60-minute chart
- Price action stuck within a descending channel structure, which could also potentially be a bullish near-term flag.
BCH/USD daily chart
- The price is flirting with a critical ascending trend line of support, a breach could cause a stronger wave of selling pressure.
Author

Ken Chigbo
Independent Analyst
Ken has over 8 years exposure to the financial markets. He started his career as an analyst, covering a variety of asset classes; forex, fixed income, commodities and equities.
More from Ken Chigbo


