Bitcoin Cash recovery stalls short of 100 SMA – What next?
- Bitcoin buyers lose confidence in the recovery as exhaustion sets in.
- Bitcoin Cash defends trendline support reversing the trend around $360.

Bitcoin posted impressive gains on Tuesday following the declines witnessed yesterday. From highs around $475 in May, the crypto has thinned to test the short-term support at $360. The plunge in the last week of May had been consolidating between a key range at $425 - $450 before the bears increased their grip in the first week of June sending BCH/USD into a tailspin.
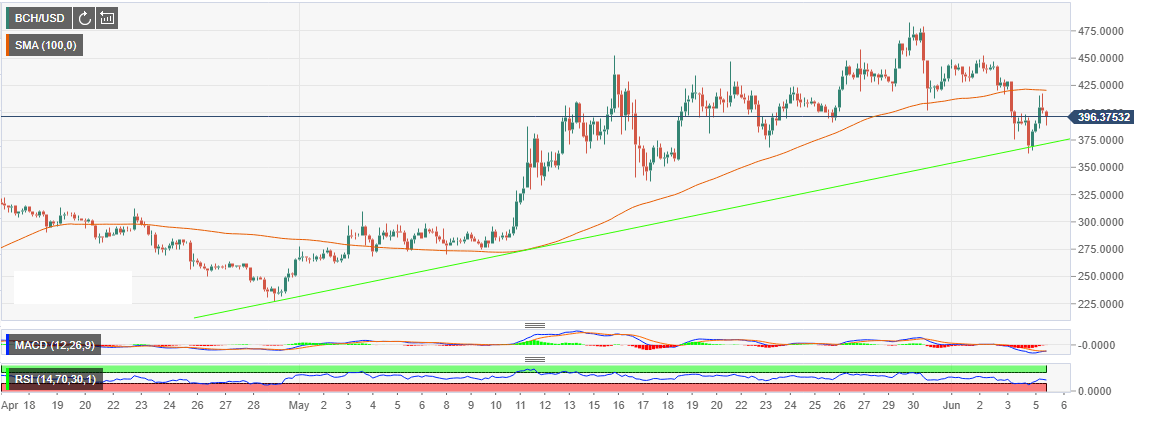
The 4-hour chart shows an asset that is still trading above a rising trendline despite the correction from the new 2019 highs. There has been a correction from the support at $360 where Bitcoin Cash pulled above $400 but the upward momentum died short of 100 Simple Moving Average currently at $420.81.
The Relative Strength Index (RSI) has recovered from the oversold but stalled just above the 50 average mark. The indicator that is now slopping slightly downwards shows that the buyers are exhausted and have lost confidence in the recovery. The MACD in the same 4-hour range has also increased from lows of -12.81 to the current -10. The divergence points towards rising bull influence. Therefore, we can expect BCH/USD to stay above the support at $360 as well as the long-term rising trendline.
BCH/USD 4-hour chart
Author

John Isige
FXStreet
John Isige is a seasoned cryptocurrency journalist and markets analyst committed to delivering high-quality, actionable insights tailored to traders, investors, and crypto enthusiasts. He enjoys deep dives into emerging Web3 tren


