|

Bitcoin Cash price could be poised for a 20% move according to key pattern

  • Bitcoin Cash price has formed a potential inverse head and shoulders pattern.
  • Only one key resistance level separates the digital asset from a 20% breakout.
  • Bulls have the upper hand in the short-term after establishing a 4-hour uptrend.

Bitcoin Cash price has been trading below a key resistance level but remains bullish in the short-term. Now, BCH aims for more after establishing a key pattern on the 4-hour chart.

Bitcoin Cash price has to crack this key resistance point

On the 4-hour chart, BCH has formed a potential inverse head and shoulders pattern with its neckline at $545. A clear breakout above this key point would drive Bitcoin Cash price by 20% towards a high of $660. 

bch price

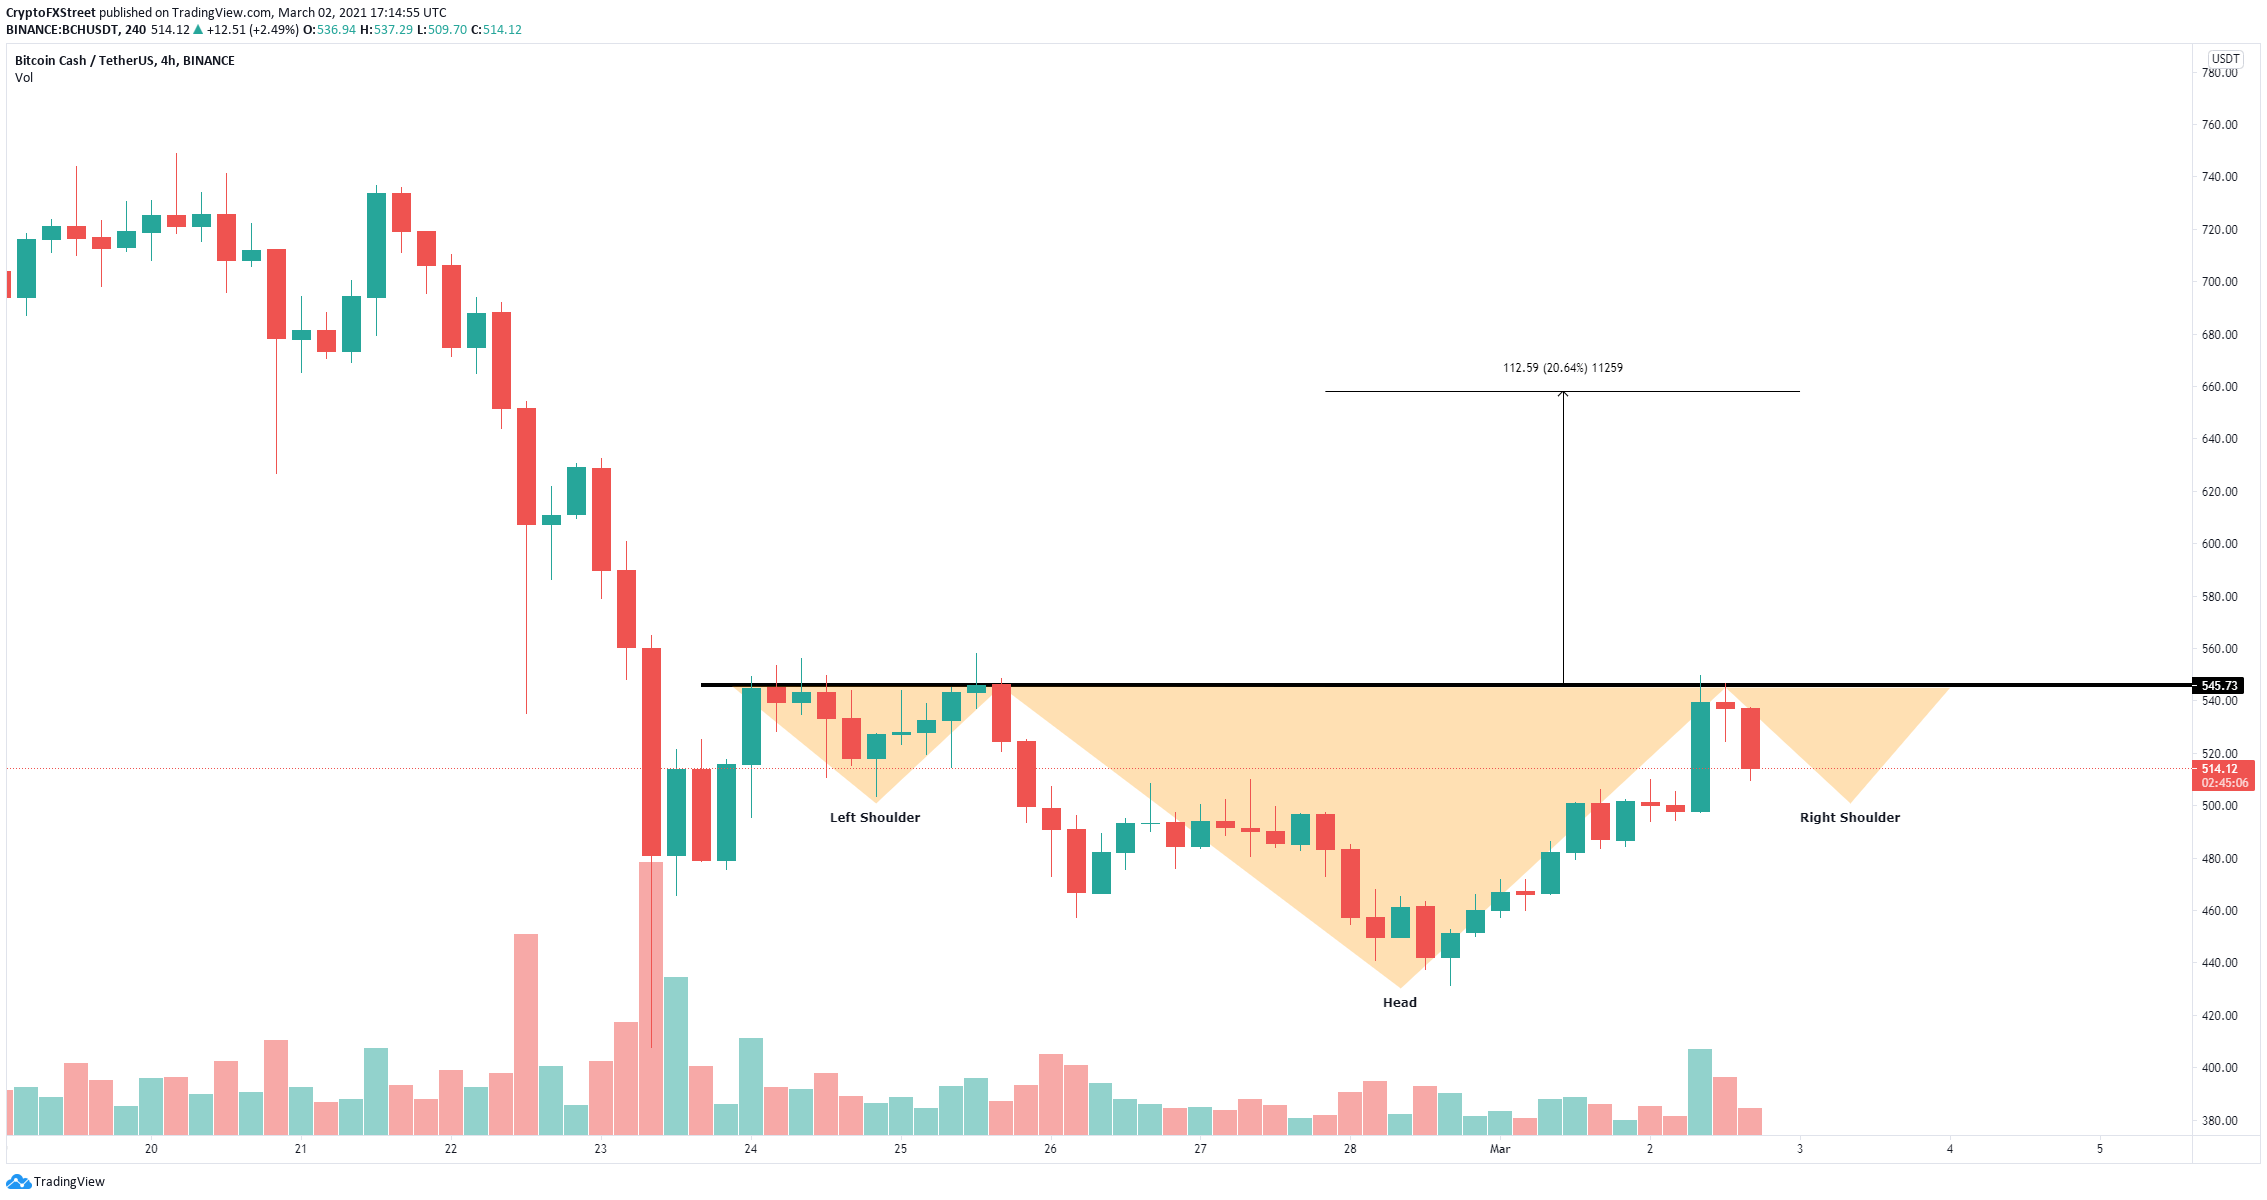
BCH/USD 4-hour chart

According to the In/Out of the Money Around Price (IOMAP) chart, there is practically no resistance. The most significant barrier is located between $528 and $544, coinciding with the neckline of the pattern above. 
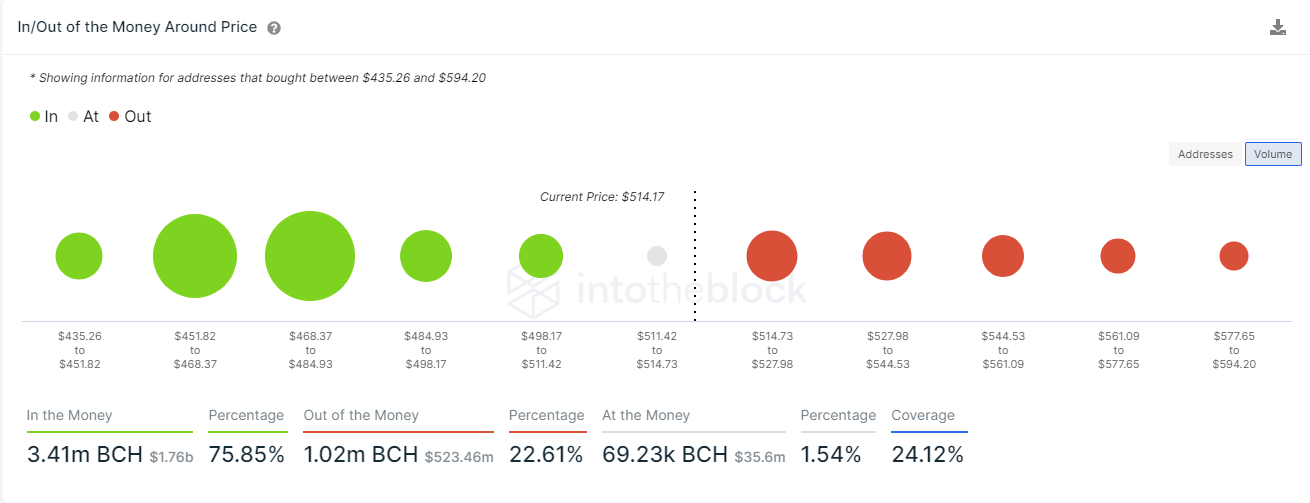
bch price

BCH IOMAP chart

On the other hand, although BCH does have strong support on the way down, a breakdown below the key area between $468 and $484 would drive the digital asset down towards $435, and would invalidate the inverse head and shoulders pattern. 

Author

Lorenzo Stroe

Lorenzo Stroe

Independent Analyst

Lorenzo is an experienced Technical Analyst and Content Writer who has been working in the cryptocurrency industry since 2012. He also has a passion for trading.

More from Lorenzo Stroe
Share:

Editor's Picks

Ripple extends losses as derivatives interest cools

Ripple (XRP) extends its bearish roll near $1.12 support on Friday, reflecting intense headwinds in the broader crypto market largely attributable to macroeconomic pressure.

Crypto Today: Bitcoin, Ethereum, XRP weaken further as capital outflows persist

Macroeconomic headwinds continue to weigh heavily on the cryptocurrency market on Friday, prompting major assets like Bitcoin (BTC) to pare earlier gains and extend losses after June’s brief relief rally.

Bitcoin Weekly Forecast: Recovery hopes fade after the Fed spoils the party

Bitcoin is set to end the week in the red, trading near the 200-Week Simple Moving Average at around $62,300 on Friday. Institutional selling persists, capping BTC’s recovery as spot Exchange Traded Funds point to a sixth consecutive week of outflows.

Sui risks a deeper bearish leg despite on-chain resilience

Sui is down 2% on Friday, extending its decline toward the recent support leg formed at $0.6618. The Total Value Locked in the Sui ecosystem has stabilized around 600 million SUI tokens, reflecting resilient user demand.

Bitcoin: Recovery hopes fade after the Fed spoils the party
Bitcoin (BTC) is set to end the week in the red, trading near the 200-Week Simple Moving Average (SMA) at around $62,300 on Friday. Institutional selling persists, capping BTC’s recovery as spot Exchange Traded Funds (ETFs) point to a sixth consecutive week of outflows.