Bitcoin Cash price analysis: BCH/USD rising wedge pattern spotted
- Bitcoin battled to hold on to the 2.1% gains on the day.
- Rising wedge pattern to launch Bitcoin Cash towards $400.

The weekend sessions showed love for the cryptocurrency market. The hibernating bulls made a swing to the upside recording impressive gains across the board. Bitcoin Cash did not lag as it soared to August new highs.
The hourly chart shows $300 level in the rear view as BCH scales the levels above $340. A high formed at $350 before retracement took effect. At press time, Bitcoin Cash is trading at $343 while holding onto the 2.1% gains on the day.
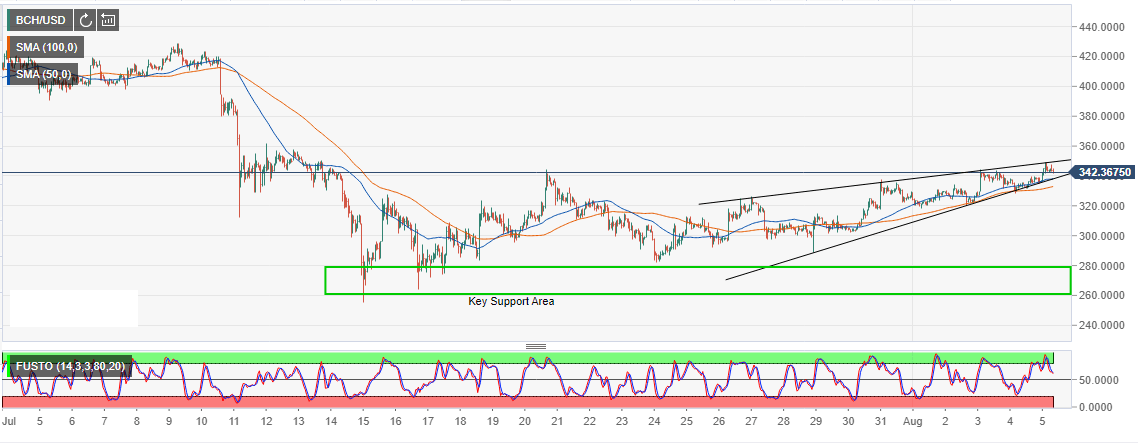
Glancing ahead, Bitcoin Cash is approaching the rising wedge pattern breakout. Trading above the pattern resistance could boost Bitcoin Cash towards $400. Moreover, Bitcoin Cash is strongly supported initially by the 50 Simple Moving Average (SMA) 1-hour chart currently at $333.62. The next support target is the 100 SMA 1-hour holding ground at $332.60.
The primary support holds ground at $320 while $300 will try to stop overstretched losses in case of a reversal. The buyers must be aware that Bitcoin Cash dived to lows around $255 in July and therefore the primary support at $260 - $280 is very important.
BCH/USD 1-hour chart
Author

John Isige
FXStreet
John Isige is a seasoned cryptocurrency journalist and markets analyst committed to delivering high-quality, actionable insights tailored to traders, investors, and crypto enthusiasts. He enjoys deep dives into emerging Web3 tren


