Bitcoin Cash price analysis: BCH/USD may still be in for large fall, despite jumping 5% on Thursday
- Bitcoin Cash jumps over 5%, but the bears may still be on the side lines waiting to resume pressure.
- On the weekly chart, a head and shoulders pattern formation is still eyed, neckline seen at $760, right shoulder is close to completion.

The Bitcoin Cash price made a recovery on Thursday, pushing higher, seen up over 5% the latter stages of the session. It appears that the bears are taking a large deep breath, from the heavy selling they have been pursuing across the cryptocurrency market.
BCH/USD, like a several other large altcoins is trading within its third consecutive week in negative territory. The market over this period has simply just resumed the dominant theme seen through 2018 so far, with the markets in firm control of taking the altcoins lower, erasing 2017 gains.
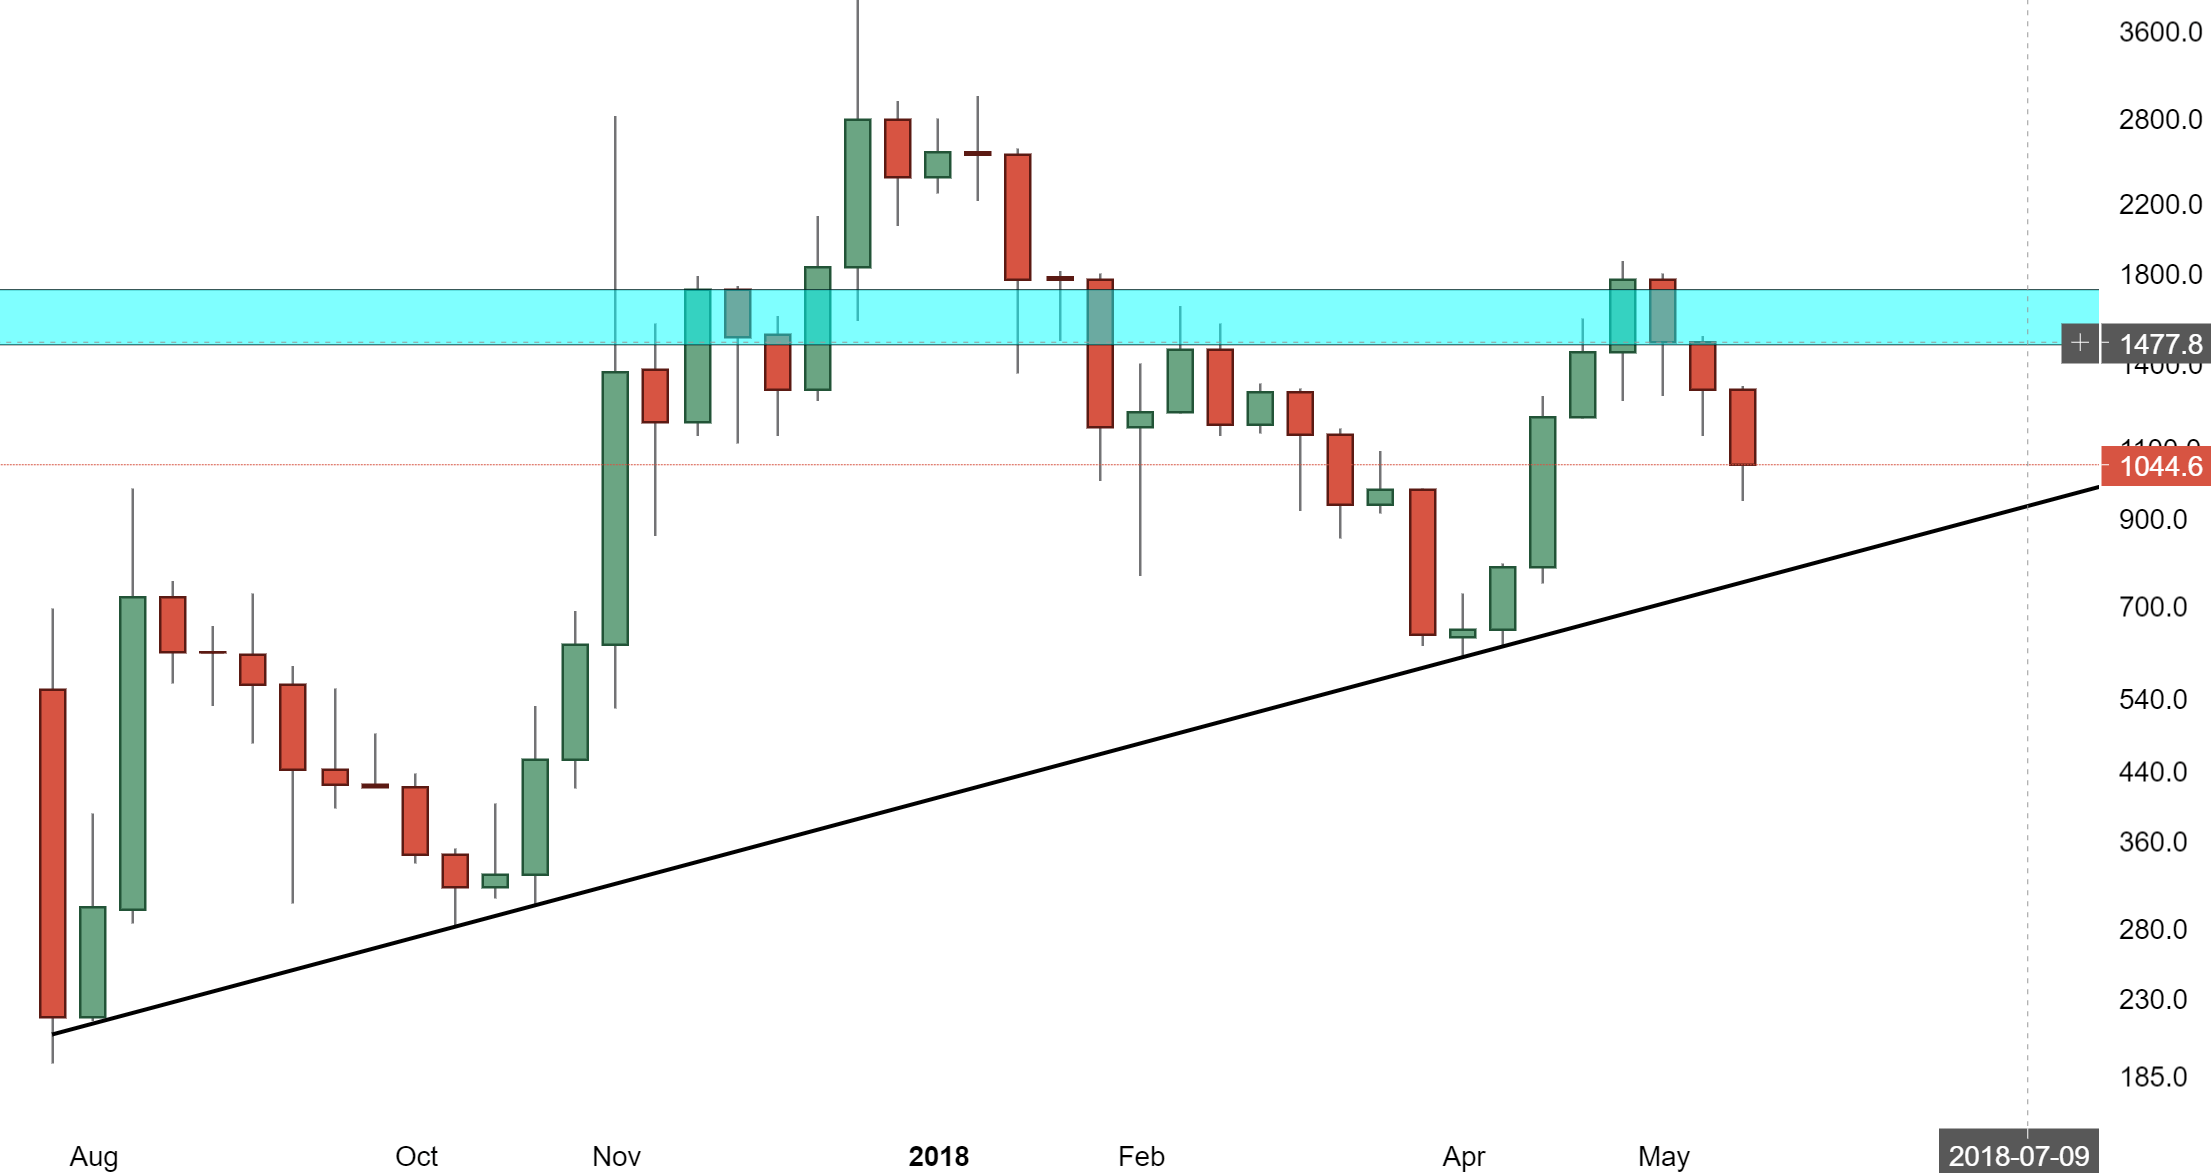
Technically, despite the gains seen in the session on Thursday, there is still some potential danger of further downside for BCH/USD. Viewing the weekly chart, a head and shoulders pattern is still eyed, the left shoulder and head have formed, with the right shoulder close to completion, in testing the neckline. They key level is seen around $760, a breach of this neckline could open the flood gates to disaster for the price. An extreme downside target can be eyed at $300, where the price consolidated before its big press higher in October 2017. There isn’t much resistance until the above supply zone, $1400-1700.
BCH/USD weekly chart
Author

Ken Chigbo
Independent Analyst
Ken has over 8 years exposure to the financial markets. He started his career as an analyst, covering a variety of asset classes; forex, fixed income, commodities and equities.


