Bitcoin Bulls in Danger as Price Drops $500 in Minutes Under $10K

For the past few days, the price of Bitcoin (BTC) has been hovering above the 20 Moving Average (MA) and drawing closer to the moving average as volume continued to taper off and lower highs were set each day.
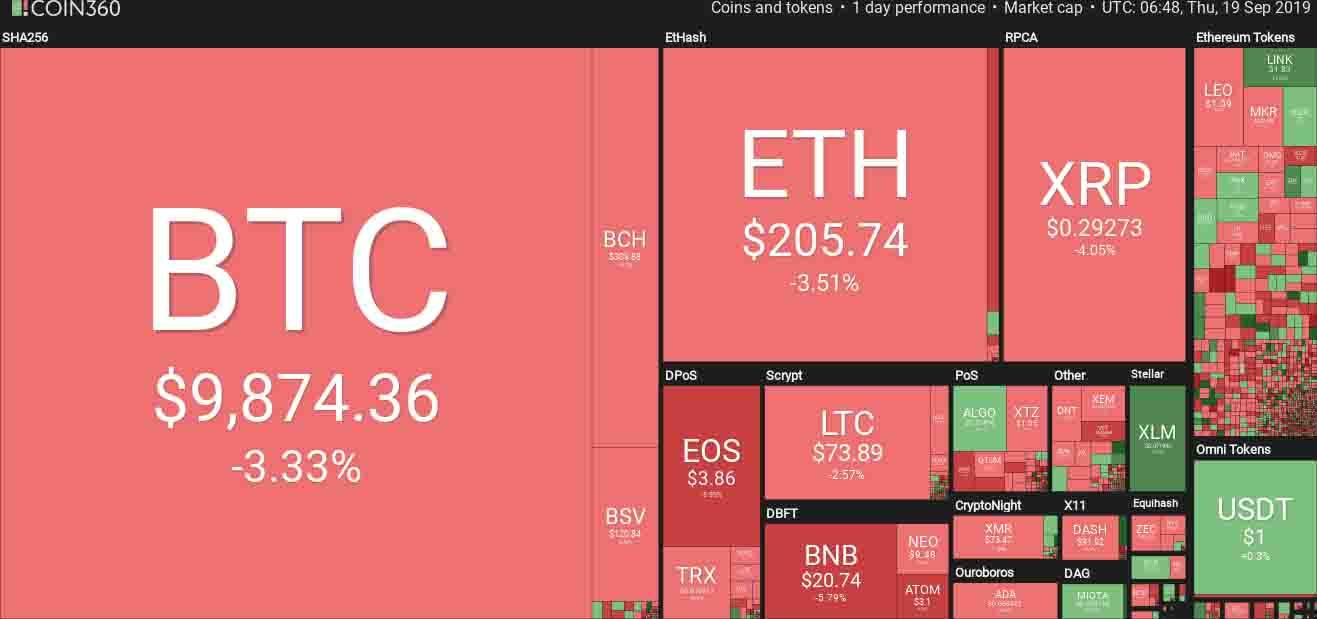
Crypto Market Data Source: Coin360
The digital asset began to look bearish on multiple time frames and it seemed that a downward move was more likely than any other outcome. Once the 12 Exponential Moving Average (EMA) dropped below the 26-EMA on Sept. 16, aggressive intraday traders correctly predicted a double bottom bounce at $10,075.
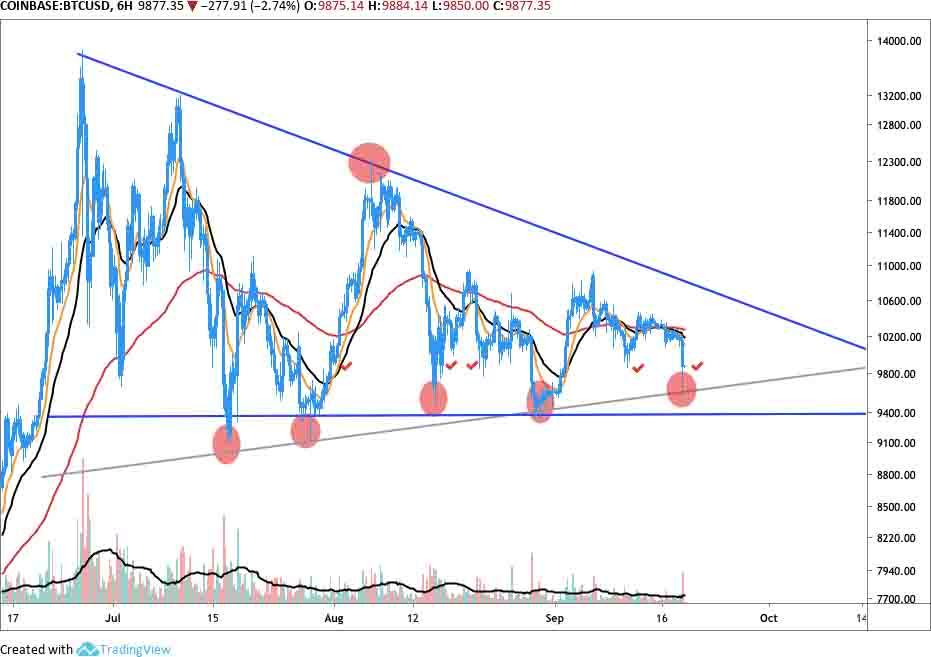
BTC/USD 6hr Chart Source: TradingView
As this price was hit for a third time on Wednesday amidst the continuation of lower highs, a bearish breakdown was on the cards.
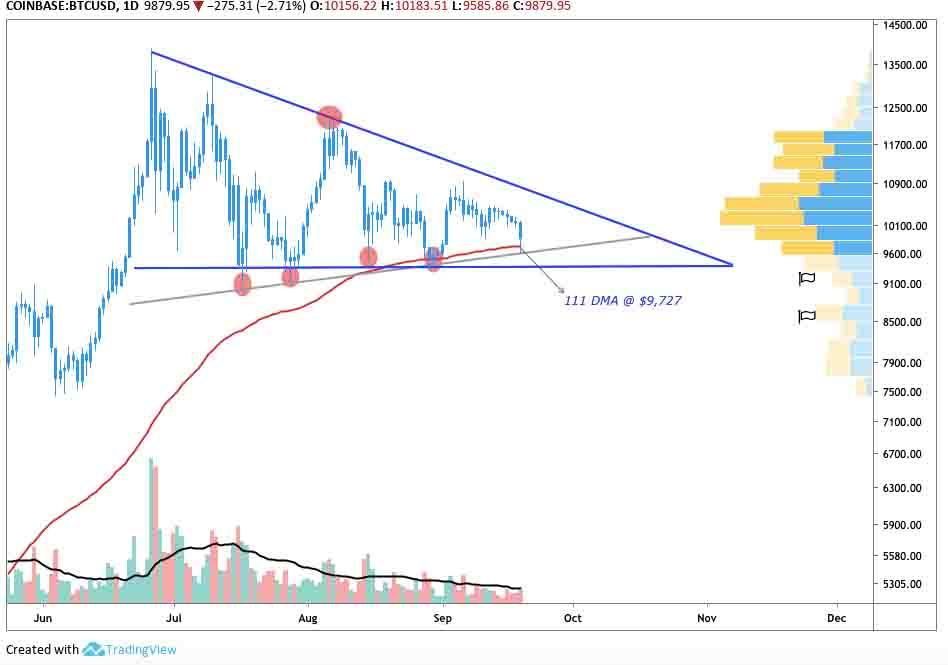
Surely, many traders are panicking given that the Bitcoin is fast approaching the termination point of the descending wedge. Everyone is expecting volatility and fingers are crossed in hopes Bitcoin will make an explosive upside move, which — when taking a view of the bigger picture — is certainly not off the table.
BTC/USD Daily Chart Source: TradingView
The most recent drop brought Bitcoin price right to the 111 Day Moving Average (DMA), a point that has reliably functioned as a bounce point since Apr. 2. The 111 DMA lines up with the $9,600 support and a drop below this point brings BTC closer to exiting the base of the descending wedge at $9,385. This level has also functioned as a support and bounce point for Bitcoin since July 16.
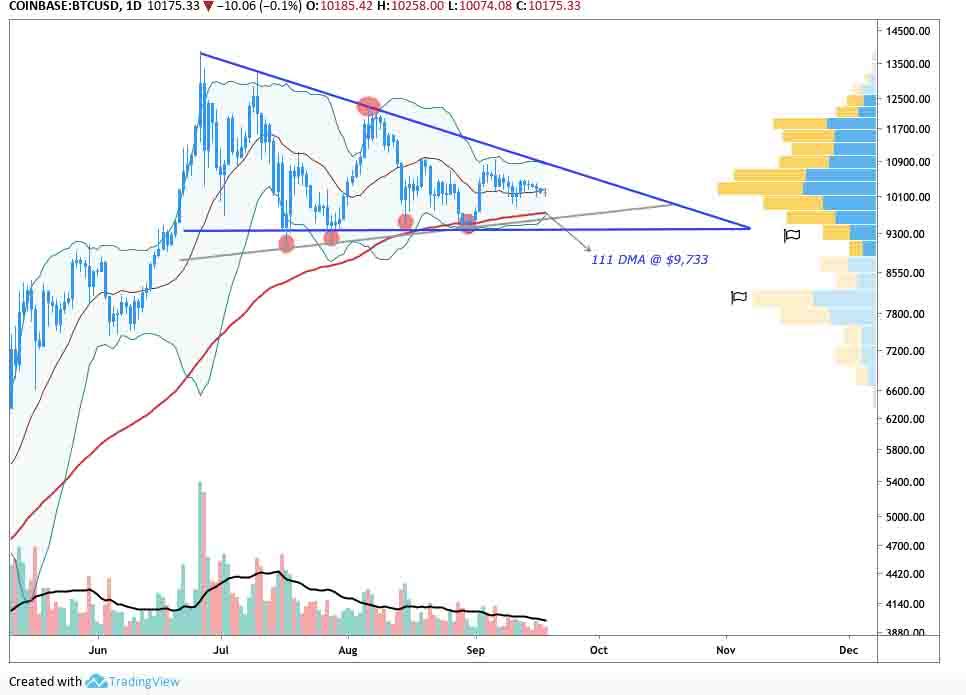
The pullback to the 111 DMA also lines up with the lower Bollinger Band arm and traders will note that the VPVR shows diminished demand below $9,500 until about $8,800. A drop below $9,300 would draw concern as there is minimal purchasing demand until below $8,600.
BTC/USD Daily Chart Source: TradingView
Macro trumps micro when it comes to Bitcoin investing
Bitcoin Golden Ratio creator Philip Swift recently advised traders to keep a hawk’s eye on Bitcoin’s historical volatility, which is dropping precipitously at the moment. Swift tweeted:
“It’s now very possible that BTC just goes sideways for a while now. If that scenario plays out, then it is worth keeping an eye on Historical volatility — currently dropping quickly. It would present a lovely long position trade opportunity when it drops down to the green box.”
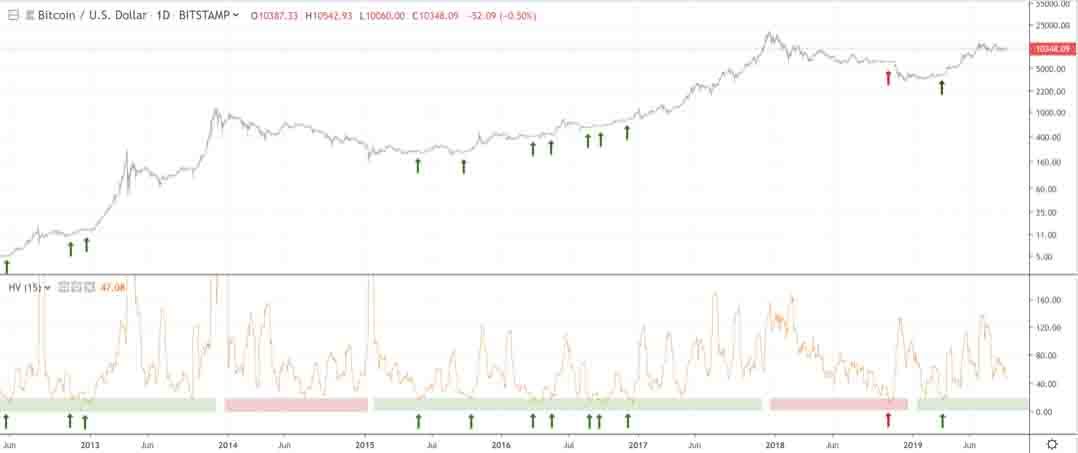
BTC/USD Daily Chart Source: Philip Swift / TradingView
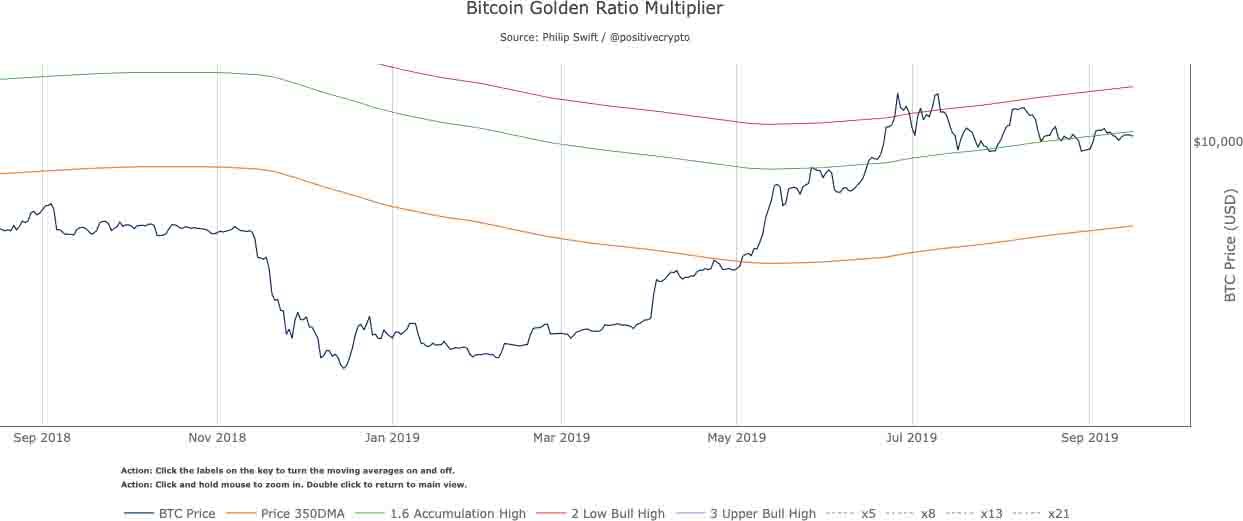
Bitcoin Golden Ratio Multiplier Souce: Philip Swift
Thought the indicator has a lag in reflecting Bitcoin’s spot action based on the API updates of the exchanges where it draws data, Swift’s Bitcoin Golden Ratio indicator shows BTC has dipped below the 1.6 (green line), which represents the higher level of a Bitcoin accumulation phase.
While it's unlikely that Bitcoin price will drop back to the 350 DMA (orange) at $6,562 it does suggest that if crucial supports fail to hold, Bitcoin could trade sideways for some time in a further prolonged accumulation phase into the 2020 halving event.
All is not lost if this bearish situation was to play out, at this point, a drop to $9,350 or below could present an excellent opportunity to enter a low-leverage long position. If one backtests previous dips to $9,350 and $9,100, we can safely conclude that taking a low-leverage position at these price points would have produced satisfying profits.
The weekly time frame is not bearish, yet…
Popular crypto analyst Filb Filb also zoomed out to the weekly timeframe and reassured investors that all is well with Bitcoin from a macro perspective.
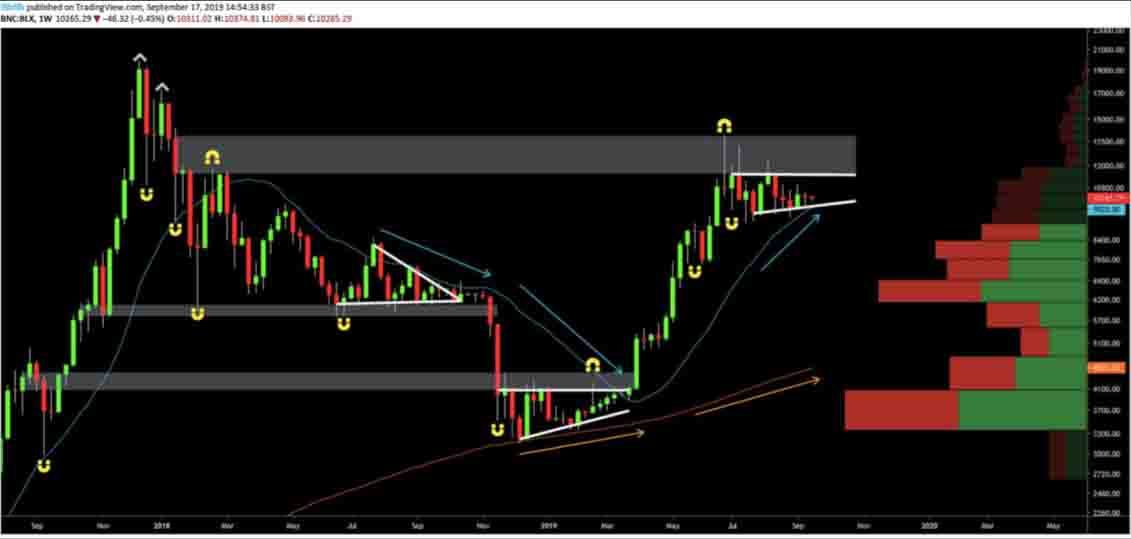
BTC/USD Source: Filb Filb / TradingView
According to Filb Filb, this “wick fill narrative for the weekly BTC chart removes a lot of noise.”
He added:
“Prepared for the worst but this doesn’t scream descending triangle top into 50% selloffs to me. Also, VPVR gap at 6K was below — this time it is above. Just worth bearing in mind.”
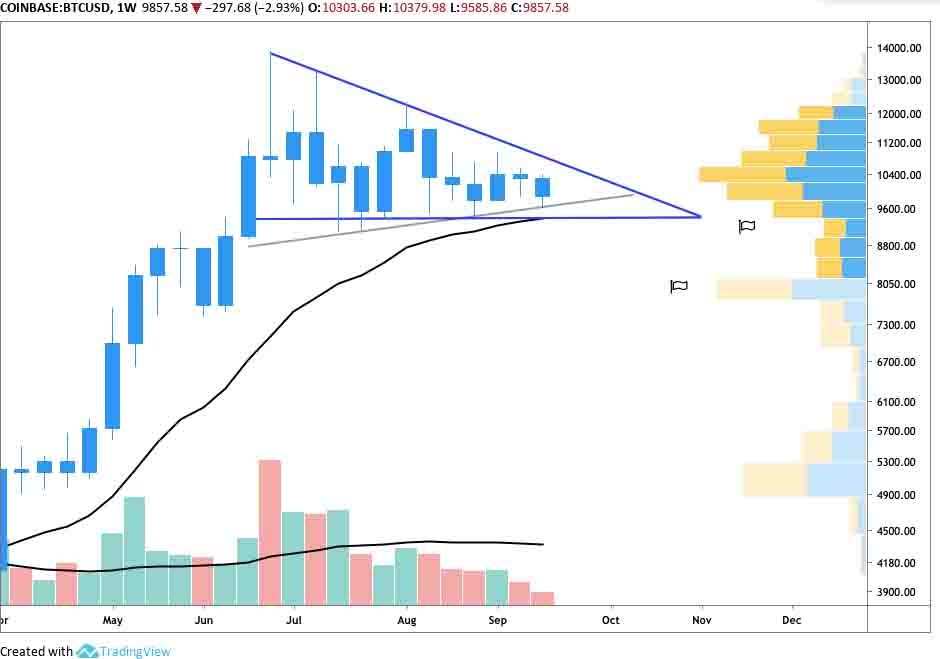
BTC/USD Weekly Chart Source: TradingView
As shown above, at the moment the weekly time frame is still encouraging with BTC continuing to pull away from a rising 20-WMA. The weekly high of $10,370 still reaches for the upper arm of the descending wedge but the succession of weekly lower highs does warrant attention.
It’s natural that BTC’s price will tighten with occasional volume spikes as Bitcoin draws closer to the wedge termination point.
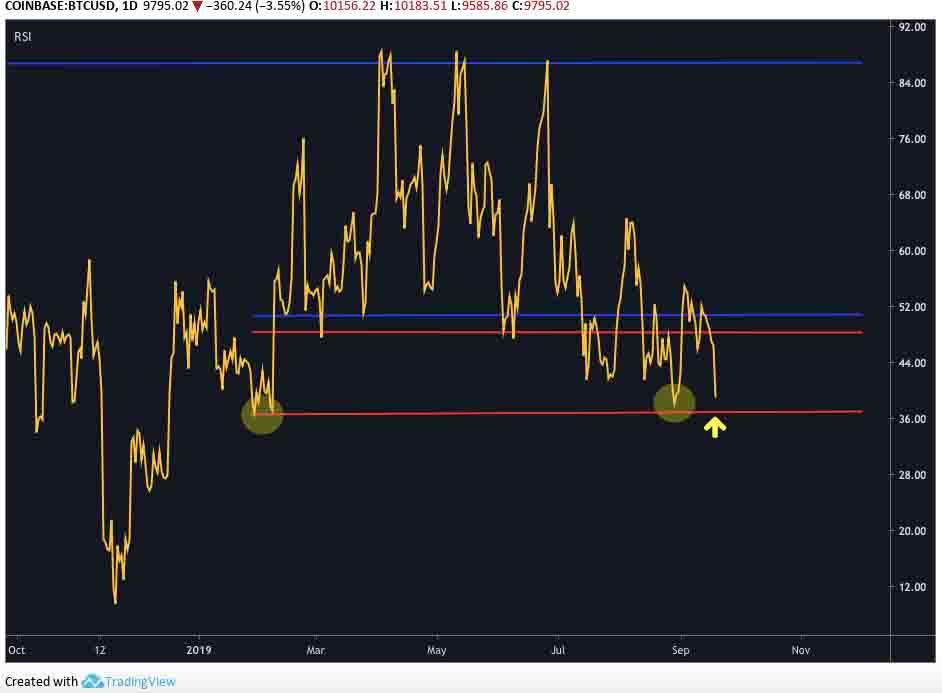
BTC/USD Daily RSI Source: TradingView
As discussed previously, the daily Relative Strenght Index (RSI) is falling toward 37, a point which has thrice been followed by an explosive upside move on Jan. 28, Feb. 7 and Aug. 28.
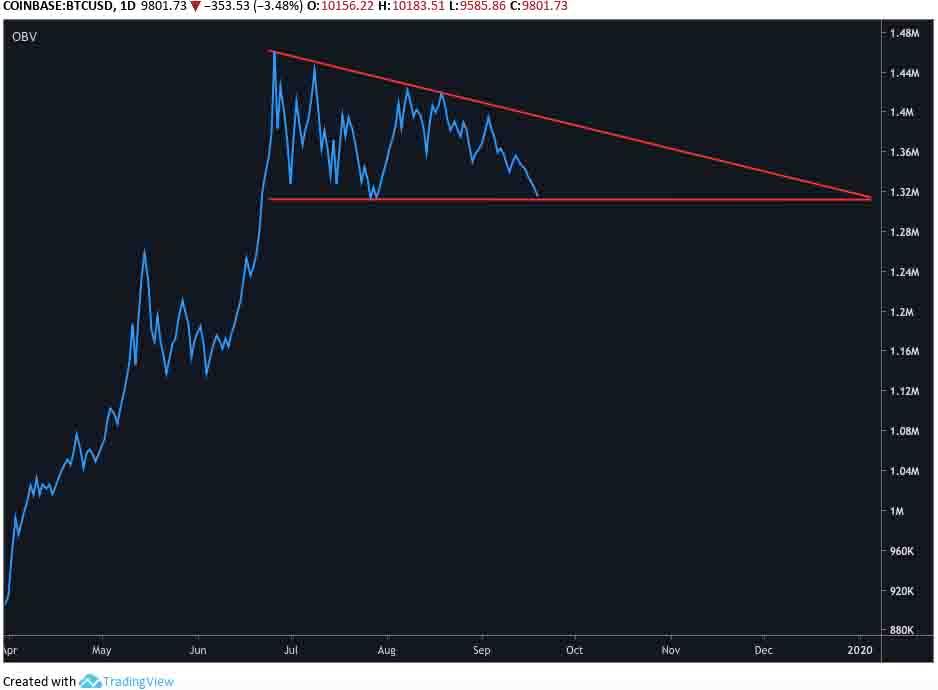
BTC/USD OBV Source: TradingView
The same could be said for the daily On Balance Volume and traders should watch to see if a lower than 1.311, a point not breached since July 29.
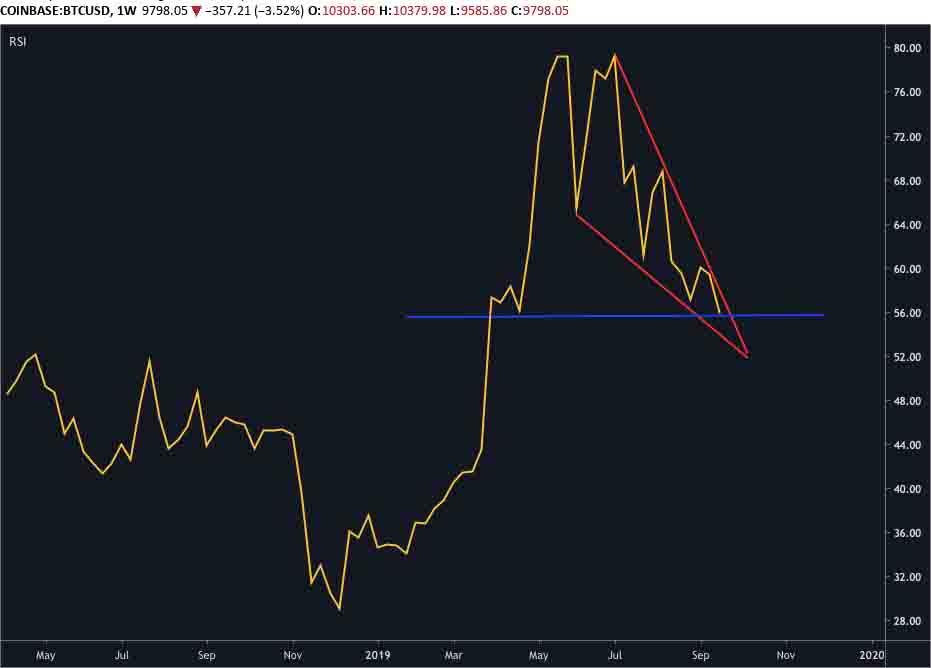
BTC/USD Weekly RSI Source: TradingView
The weekly RSI is also clearly up to something. Perhaps in a worst-case scenario Bitcoin price will fall to $9,300, touch the bottom of the triangle on the weekly RSI, then reverse course, working its way back above $10K and on towards the overhead resistance at $10,250.
Ultimately, Bitcoin price has flashed bearish signals for a few days now and a downside break seemed imminent. Now that it has occurred the next step is to see which supports hold and if Bitcoin will mirror previous bounces at the 111 DMA and descending wedge base.
Already we have seen buyers step in around $9,600 to buy the dip. One would imagine that a dip to $9,350 would inspire even strong purchasing demand.
Author

Cointelegraph Team
Cointelegraph
We are privileged enough to work with the best and brightest in Bitcoin.



