Bitcoin bullish wicks on daily candles show buying pressure
-
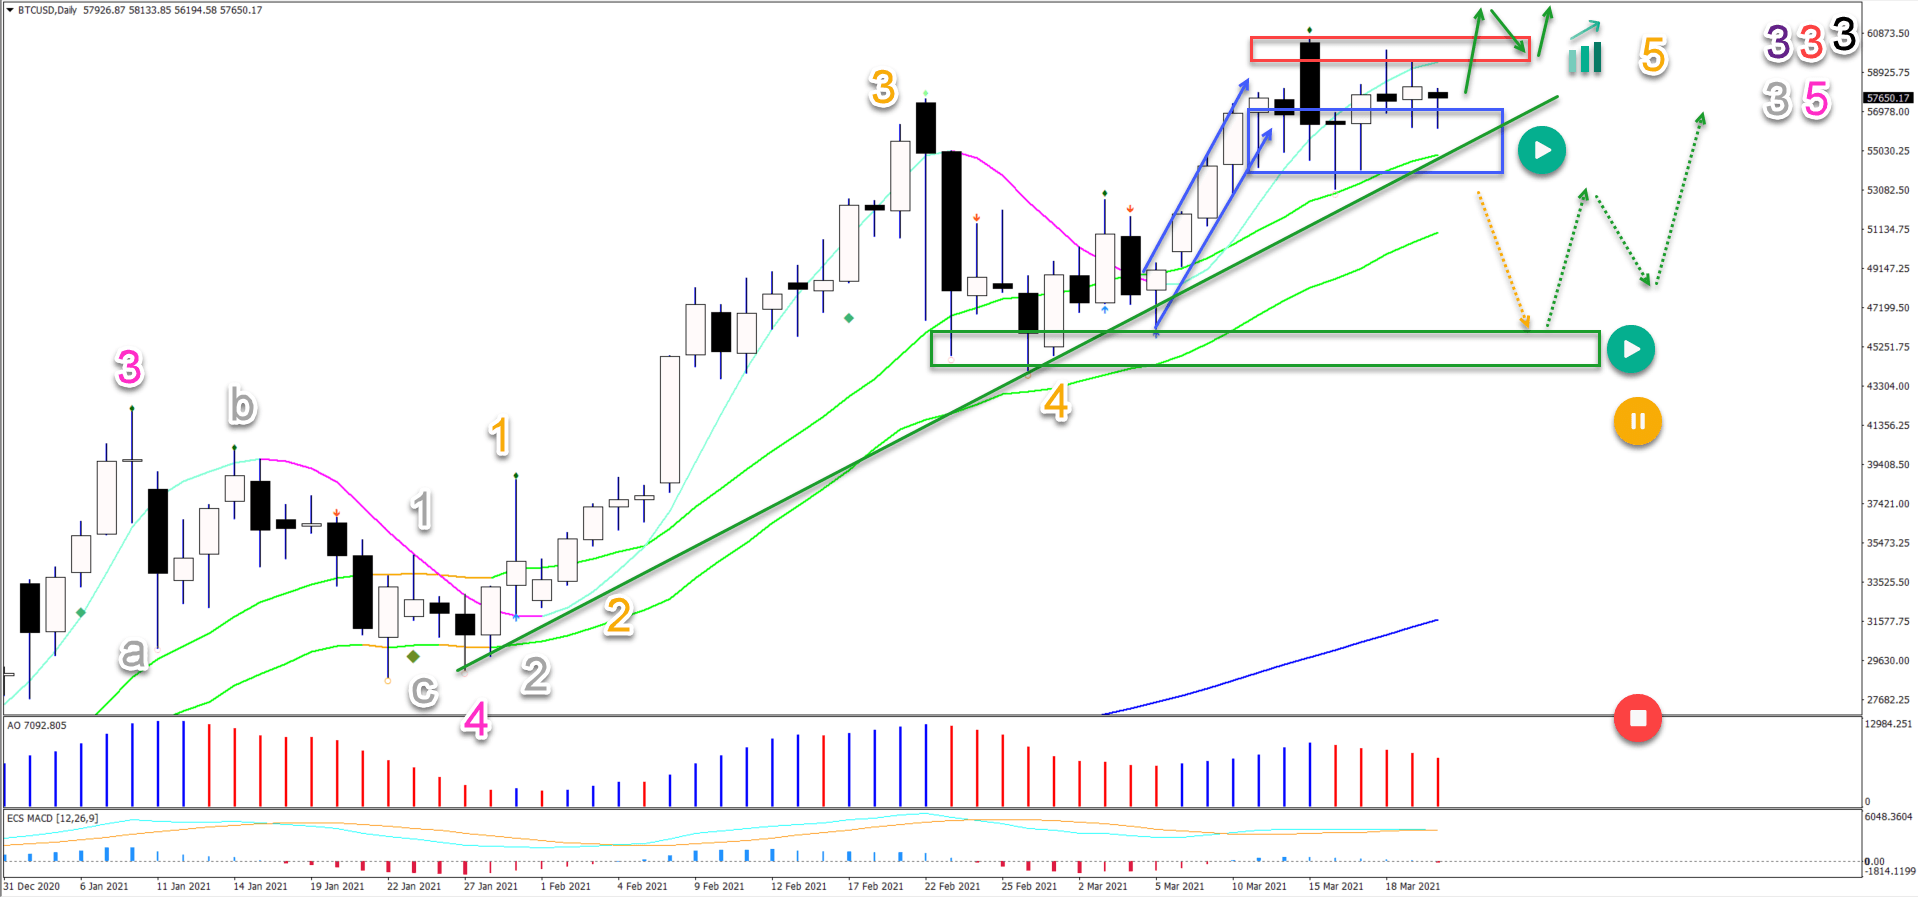
Bitcoin (BTC/USD) is showing strong buying pressure… But price action has been unable to break sustainably above the previous top.
-
The BTC/USD daily chart is moving sideways. But buyers are stepping in as soon as price enters the $54-56,000 support zone (blue box).
-
BTC/USD is either building a new uptrend or a larger correction might take place. Let’s review when we expect one of these two patterns to be confirmed.

Can the bulls keep control or is a deeper retracement around the corner?
Price charts and technical analysis
The BTC/USD daily chart is moving sideways. But buyers are stepping in as soon as price enters the $54-56,000 support zone (blue box).
If we also consider a) uptrend and b) the bullish impulse before (blue arrows), then the bulls still remain firmly in control. Let’s review:
-
Price action needs to break above the previous top and resistance (red box) to confirm an immediate breakout and uptrend continuation (green arrows).
-
An uptrend could confirm a wave 5 (orange) pattern.
-
The larger wave patterns indicate potentially more upside as the wave 5 (orange) completes a wave 3 (grey) of wave 5 (pink) of waves 3 (purple, red, black).
-
A break below the support, however, indicates a deeper retracement (dotted orange arrow). In that case, price action could test the previous wave 4 (orange) bottom (green box). A bullish bounce is expected there (dotted green arrows).
On the 4 hour chart, BTC/USD is either building a new uptrend or a larger correction might take place. Let’s review when we expect one of these two patterns to be confirmed:
-
A bullish breakout (green arrows) above the resistance (orange box) confirms that a wave 4 (light blue) is completed and that price action is moving up for a wave 5. The current chart pattern looks like a bullish ascending wedge pattern.
-
A light pullback (orange arrow) could indicate a larger ABC (green) correction in wave 4 (light blue).
-
A deeper retracement (red arrows) could indicate a change of the wave outlook. The 123 (light blue) pattern is invalid and a larger wave 4’ (orange) is taking place.
-
The bulls remain in control as long as price action remains above the support zone (21 emas and support trend line (green).

The analysis has been done with the ecs.SWAT method and ebook.
Author

Chris Svorcik
Elite CurrenSea
Experience Chris Svorcik has co-founded Elite CurrenSea in 2014 together with Nenad Kerkez, aka Tarantula FX. Chris is a technical analyst, wave analyst, trader, writer, educator, webinar speaker, and seminar speaker of the financial markets.


