Bitcoin Bollinger Bands echo move that ended in 40% January gains

Bitcoin (BTC $29,881) is lining up a burst of volatility that could rival its 40% January gains, on-chain data suggests.
In the latest edition of its weekly newsletter, The Week On-Chain, analytics firm Glassnode revealed the tightest Bollinger Bands since the start of 2023.
BTC price due “strong moves” – But direction unknown
BTC price has acted in a tight range for an entire month, using $30,000 as a focal point for sideways behavior.
This, popular analyst Aksel Kibar says, is putting both bulls and bears to the test.
“Seems like $BTCUSD is exhausting many trader’s patience,” he summarized on July 21.
That is usually the condition you see before strong moves. Not sure about the direction though. I will stick with my well-defined boundaries. I know that increased volatility is around the corner. Capture the directional move.
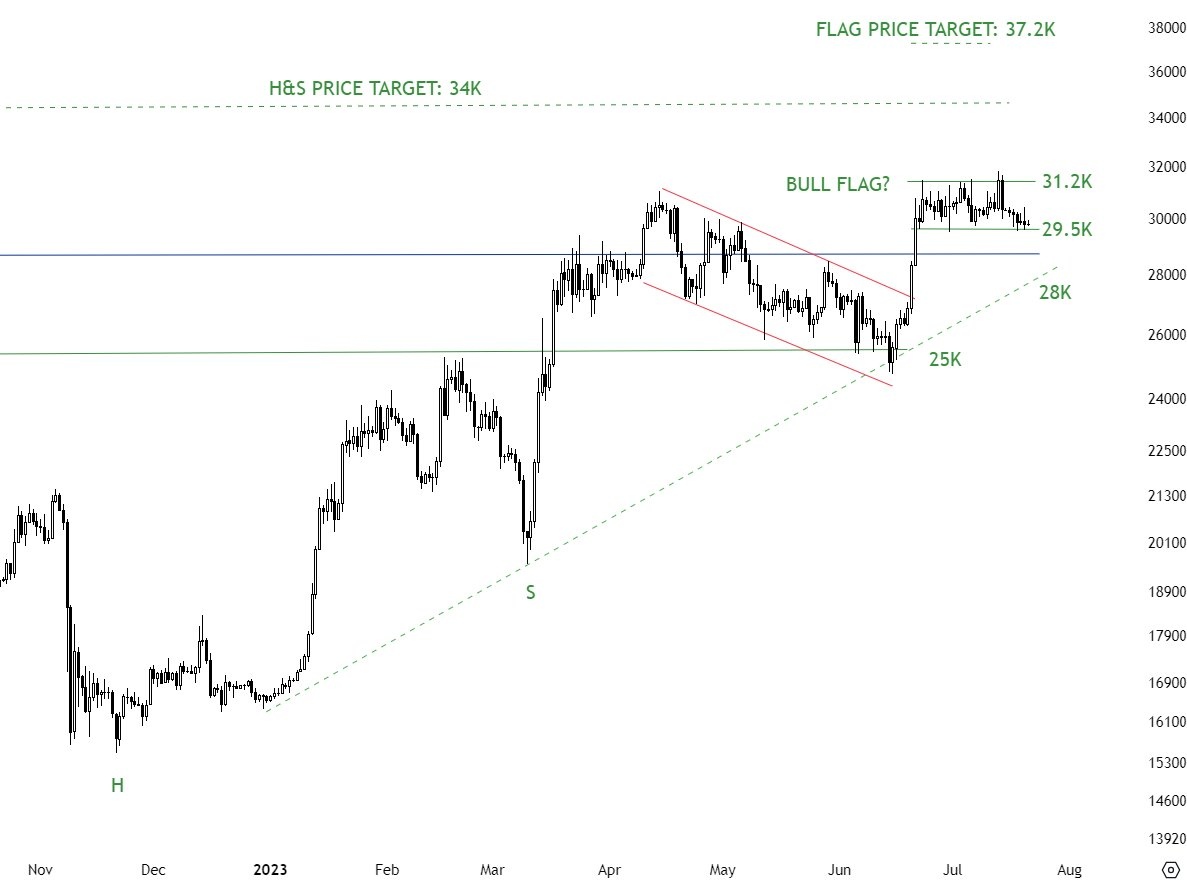
BTC/USD annotated chart. Source: Aksel Kibar/Twitter
According to Bollinger Bands behavior, that move should come sooner rather than later.
The classic volatility indicator is currently printing a telltale sign that the days of rangebound BTC price action are numbered.
Bollinger Bands use standard deviation around a simple moving average to determine when an asset’s price is due a shift in trend.
On BTC/USD, its upper and lower band are unusually close together at present — more compact, in fact, than at any time since Bitcoin began its 2023 upside.
“The digital asset market continues to see remarkably little volatility, with the classic 20-day Bollinger Bands experiencing an extreme squeeze,” The Week On-Chain commented.
It added that with a range of just 4.2%, this marked the “quietest BTC market since the lull in early January.”
At the time, Bitcoin saw a breakout which then continued throughout the month, bringing January gains to around 40%.
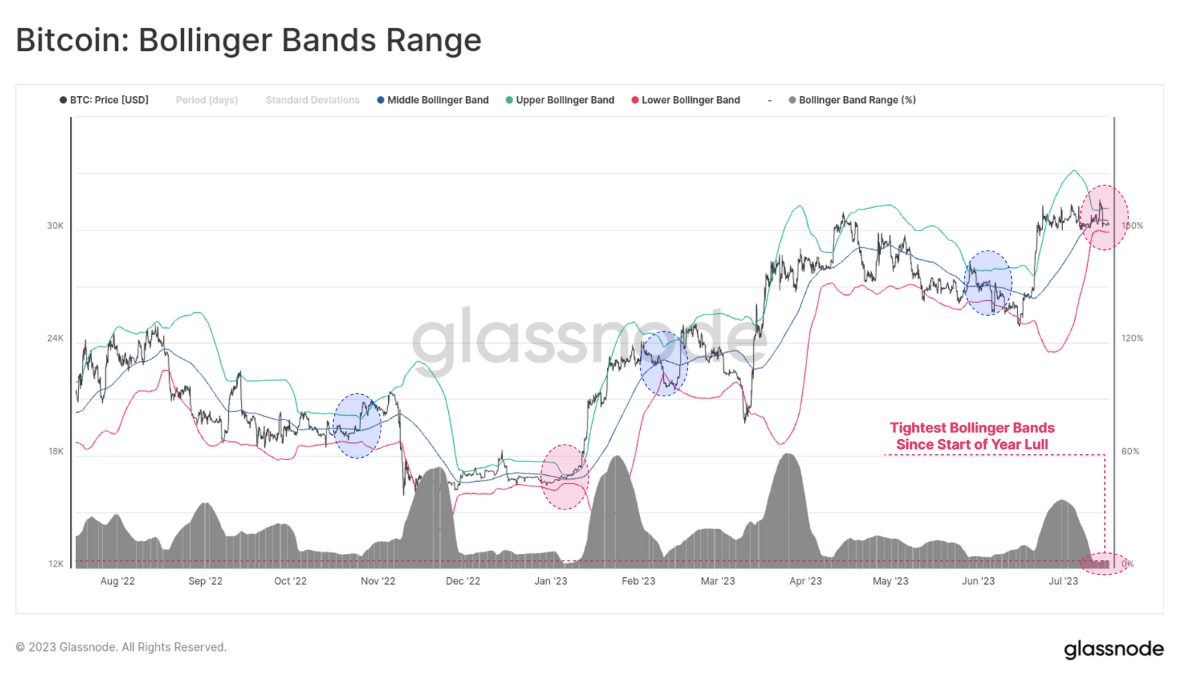
Bitcoin Bollinger Bands range chart (screenshot). Source: Glassnode
Bitcoin hodlers channel early 2019
Continuing, Glassnode noted that at current levels, there was little by way of active selling — either for profit or loss.
This lack of “realized” activity comes despite the BTC price gains since January and is a historically common phenomenon in periods after price cycle lows.
“This compression in volatility is matched by cyclical lows in realized profit and loss being locked in by the market,” it wrote.
The sum of profits plus losses currently equals around $290 million per day.
“Whilst this is a significant sum on a nominal basis, it is again comparable to the 2019 peak, and to October 2020 where BTC prices were 50% lower than they currently are,” Glassnode explained.
As such, it suggests that even though the Bitcoin market cap is ~2x larger today, investors who are holding large profits or losses are extremely unwilling to spend their coins on-chain.
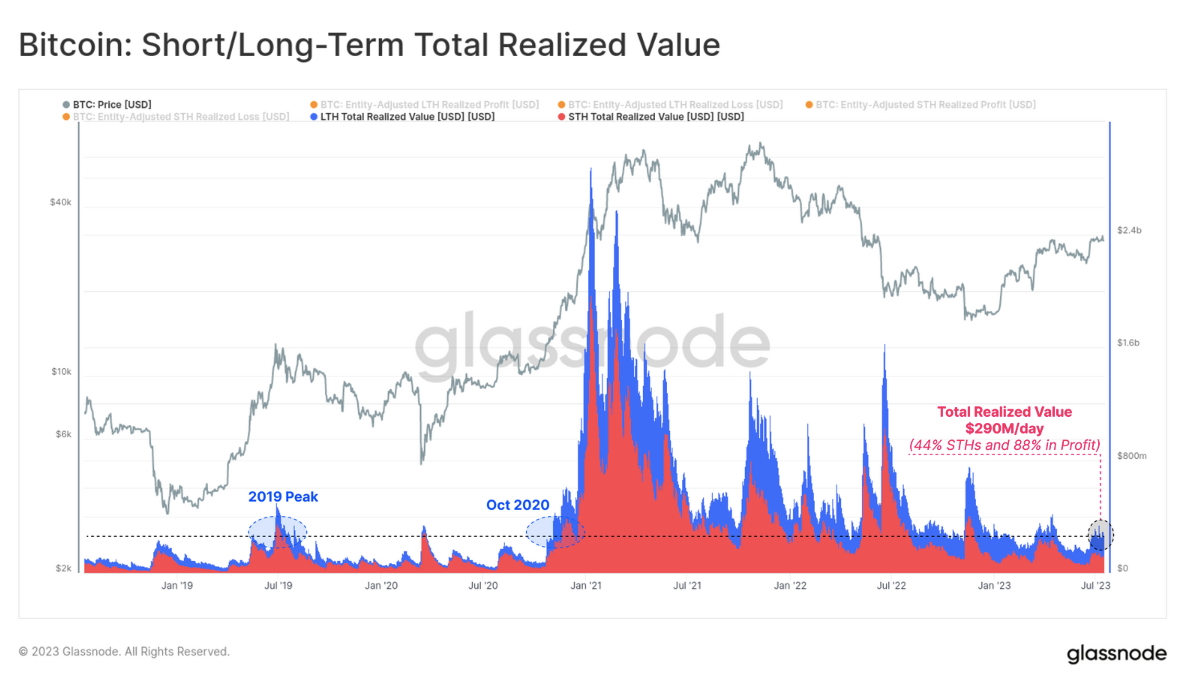
Bitcoin short/long-term total realized value chart (screenshot). Source: Glassnode
Author

Cointelegraph Team
Cointelegraph
We are privileged enough to work with the best and brightest in Bitcoin.



