Bitcoin price recovery likely after BTC dips below $40,000, according to on-chain metrics
- Bitcoin price fell below the $40,000 level on Tuesday, alongside altcoins with large market capitalization.
- Bitcoin is poised for a recovery according to on-chain metrics from Santiment.
- BTC price recovery depends on the market sentiment, continued pessimism could trigger a bounce in Bitcoin.

Bitcoin price hit a low of $39,400 on Monday after a market-wide bloodbath ushered in a correction in cryptocurrencies with a large market capitalization. BTC made a comeback above the psychological level of $40,000 on Tuesday, and on-chain metrics are showing signs of a further recovery in the asset.
Also read: Bitcoin price is above $41,000 as BTC whales make strategic moves
Daily Digest Market Movers: bullish signs in on-chain metrics appear
- Bitcoin price dropped to a $39,400 low on January 22 as Grayscale’s GBTC noted a $640 million outflow. BTC ETF outflows picked up pace on Monday, acting as one of the key drivers for Bitcoin price decline.
- Bloomberg ETF analyst, James Seyffart shared details of capital inflow/outflows to BTC ETFs in a recent tweet:
Woof. BAD day for #Bitcoin ETFs overall in the Cointucky Derby. $GBTC saw over $640 million flow out today. Outflows aren't slowing -- they're picking up. This is the largest outflow yet for GBTC. Total out so far is $3.45 Billion. (Don't have BlackRock data yet) pic.twitter.com/jNOyiTADVq
— James Seyffart (@JSeyff) January 23, 2024
- The Bitcoin derivatives market shuddered in response to BTC’s price drop below the $40,000 psychological level.
- Coinglass data indicates $50.47 million in long positions and $12.23 million in short positions were liquidated in the past 24 hours. Bitcoin derivatives traders suffered $62.7 million in liquidations in a 24 hour timeframe. Bitcoin options volume declined nearly 40% and open interest dipped by 3%, following the concerning drop in the asset’s price.
- While the price statistics paint a grim picture of Bitcoin recovery, on-chain metrics signal that there is bullish potential in BTC.
- Analysts from on-chain metric platform Santiment assessed Monday’s crypto market crash and identified signs of recovery in Bitcoin.
- The Market Value to Realized Value (MVRV) metric reads negative 7.187% on Tuesday. MVRV peaked at 8.59% on January 8, days ahead of the SEC’s decision on spot Bitcoin ETFs. Since the approval, there has been a gradual dip in MVRV, meaning traders who acquired BTC in the past 30 days are sitting on unrealized losses. 7.187% traders are sitting on unrealized losses on their BTC holdings, as of January 23.
- Typically, when MVRV dips in the negative territory below negative 5%, it is followed by a bounce in the asset’s price, if other factors like market sentiment support a recovery.
 [12.45.55, 23 Jan, 2024]-638415931091362565.png)
Bitcoin MVRV Ratio (30-day). Source: Santiment
- The sentiment among traders has gradually improved between January 14 and 23. At its lowest, the weighted sentiment among market participants was negative 0.81, it has climbed to negative 0.35. It's important to note that if sentiment remains in the negative territory, representing market wide pessimism on BTC price recovery, then combined with MVRV below negative 5%, it can be considered a promising sign for a recovery in Bitcoin price.
 [12.48.46, 23 Jan, 2024]-638415931342232537.png)
Bitcoin weighted sentiment. Source: Santiment
Technical analysis: Bitcoin eyes comeback above $41,400
Bitcoin price is in an uptrend that started on September 11. Still, the trend has lost momentum since the beginning of the year, with price action posting lower highs and lower lows.
While Bitcoin recovered somewhat from its decline below $40,000 on Tuesday, it currently trades below its two long-term Exponential Moving Averages, 10-day EMA at $41,522 and 50-day EMA at $41,886.
Prices briefly dipped into the support zone between $38,169 and $39,600, where 1 million addresses have acquired 423,590 Bitcoins.
To the upside, BTC price could face resistance at the psychological level of $40,000, the lower boundary of the next resistance zone, at $41,466, and the 50% Fibonacci retracement of its decline between October 2021 and 2022, at $43,074.
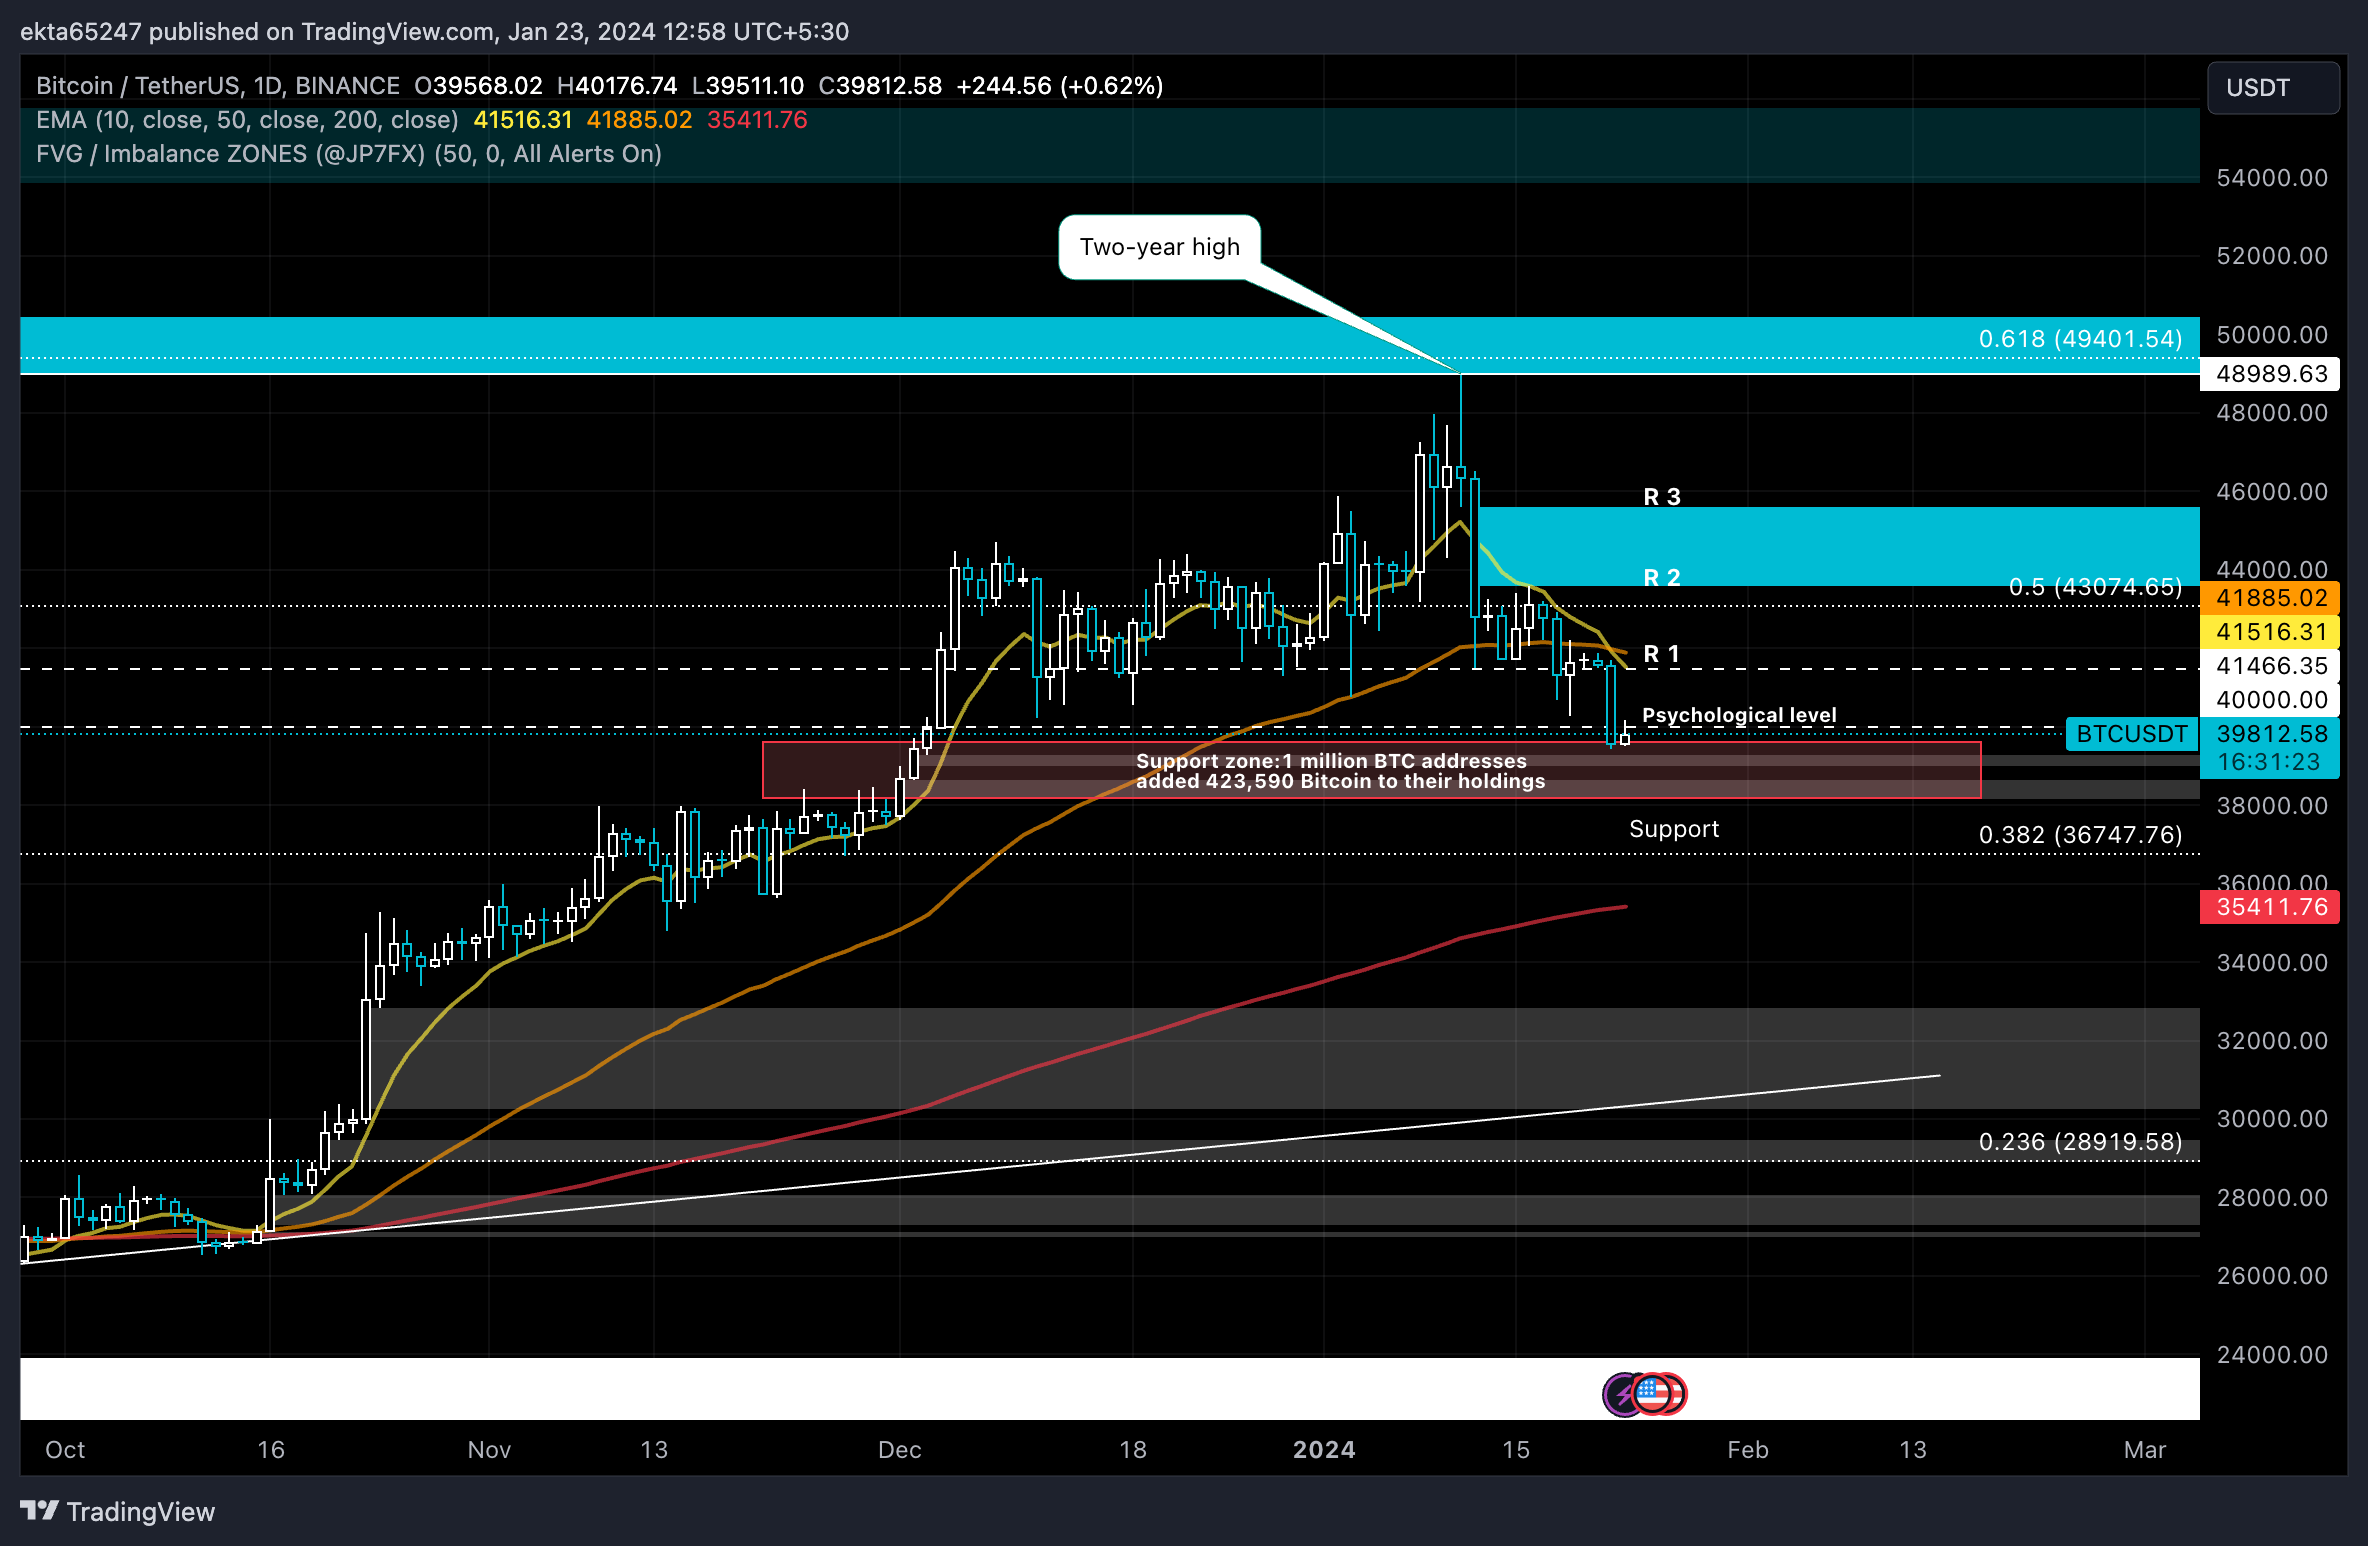
BTC/USDT 1-day chart
However, a daily candlestick close in the support zone could invalidate the thesis of Bitcoin price recovery. In the event of further declines, Bitcoin could end up in the support zone or nosedive to the 38.2% Fibonacci retracement level of $36,747.
Cryptocurrency metrics FAQs
What is circulating supply?
The developer or creator of each cryptocurrency decides on the total number of tokens that can be minted or issued. Only a certain number of these assets can be minted by mining, staking or other mechanisms. This is defined by the algorithm of the underlying blockchain technology. Since its inception, a total of 19,445,656 BTCs have been mined, which is the circulating supply of Bitcoin. On the other hand, circulating supply can also be decreased via actions such as burning tokens, or mistakenly sending assets to addresses of other incompatible blockchains.
What is market capitalization?
Market capitalization is the result of multiplying the circulating supply of a certain asset by the asset’s current market value. For Bitcoin, the market capitalization at the beginning of August 2023 is above $570 billion, which is the result of the more than 19 million BTC in circulation multiplied by the Bitcoin price around $29,600.
What is trading volume?
Trading volume refers to the total number of tokens for a specific asset that has been transacted or exchanged between buyers and sellers within set trading hours, for example, 24 hours. It is used to gauge market sentiment, this metric combines all volumes on centralized exchanges and decentralized exchanges. Increasing trading volume often denotes the demand for a certain asset as more people are buying and selling the cryptocurrency.
What is funding rate?
Funding rates are a concept designed to encourage traders to take positions and ensure perpetual contract prices match spot markets. It defines a mechanism by exchanges to ensure that future prices and index prices periodic payments regularly converge. When the funding rate is positive, the price of the perpetual contract is higher than the mark price. This means traders who are bullish and have opened long positions pay traders who are in short positions. On the other hand, a negative funding rate means perpetual prices are below the mark price, and hence traders with short positions pay traders who have opened long positions.
Author

Ekta Mourya
FXStreet
Ekta Mourya has extensive experience in fundamental and on-chain analysis, particularly focused on impact of macroeconomics and central bank policies on cryptocurrencies.


