Bitcoin battles 2-month resistance amid ‘most hated’ stocks rally

Bitcoin (BTC) pierced the top of a stubborn trading range on Aug. 11 as a decidedly awkward rally took hold of risk assets.
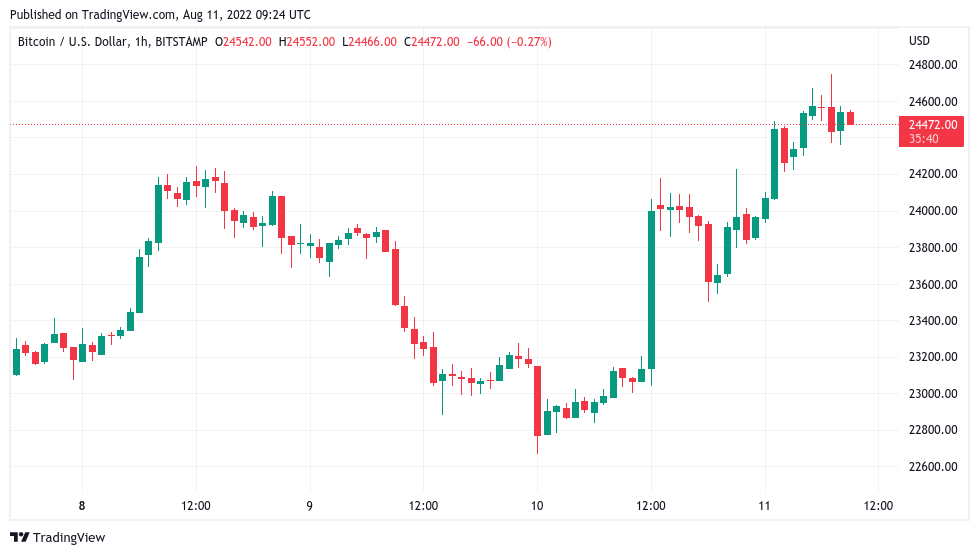
BTC/USD 1-hour candle chart (Bitstamp). Source: TradingView
Bitcoin retracement warnings intensify near $25,000
Data from Cointelegraph Markets Pro and TradingView showed BTC/USD hitting highs of $24,750 on Bitstamp, marking its best performance since June 13.
The pair had attempted several breakouts to the top of the range in prior weeks, these all failing in the face of stiff selling pressure.
New United States inflation data released this week formed a long-awaited catalyst for change, however, with Bitcoin and altcoins rising in step with equities as the Consumer Price Index (CPI) print for July suggested that inflation had peaked.
On Aug. 10, the day of the release, the S&P 500 and Nasdaq Composite Index gained 2.1% and 1.9% respectively. BTC/USD, on the other hand, saw a daily candle of around $900.
Rather than pile on the optimism, however, market commentators were anything but blanket bullish as the dust settled. Sentiment, investor Raoul Pal noted, was treating the post-CPI rally as a black sheep.
“Well, this appears to be one of the most hated rallies I've seen in quite few years in equities,” he told Twitter followers in a dedicated thread.
Pal nonetheless argued that there was a “very decent chance” that equities had seen their lows in June.
Forecasting a major change of tune in crypto, meanwhile, popular trader and analyst Il Capo of Crypto stuck by $25,500 as the maximum likely target before a new downtrend began.
“$BTC Pumped almost 40%. Huge Possibility, Retrace Coming. Buy The Dip,” fellow account Jibon continued in further Twitter comments.
A slightly more hopeful Crypto Tony meanwhile said that hodlers would be “in for a treat” if the range high managed to hold.
Eyeing potential similarities between the Bitcoin chart now and in March 2020, BTCfuel added that a further breakout was not off the cards.
Doubts emerge over Ethereum rally
The impressive performance across altcoins meanwhile put largest altcoin Ether (ETH) firmly in the spotlight after ETH/USD gained over 11%.
The pair continued its gains on the day, passing $1,900 for the first time since June 6 and now approaching the psychologically significant $2,000 mark.
The CPI momentum added to an already excitable Ethereum market, with the Goerli testnet merge — a key preparatory step for the full Merge event in September — concluding successfully.
“Since the start of this bear market rally, in the middle of June, Ethereum is gaining dominance in terms of trading volume relative to Bitcoin. In the latest few days, Ethereum and Bitcoin Dominance has even crossed,” Maartuun, a contributing analyst at on-chain data platform CryptoQuant, wrote in a blog post on Aug. 10.
Maartuun cautioned that historical precedent nonetheless did not favor a sustained rally across crypto should this continue to be led by ETH.
“It is clear that Ethereum is very popular on exchanges, because of the gaining dominance. That makes sense because of the upcoming 2.0 merge,” he added.
However, from my 5-year experience in the cryptomarket, rally's which are led by Ethereum are usually not the healthiest thing for the market. As you already could read in my previous analysis, I'm very conservative. Especially because Ethereum already made a > 100% move from the lows.
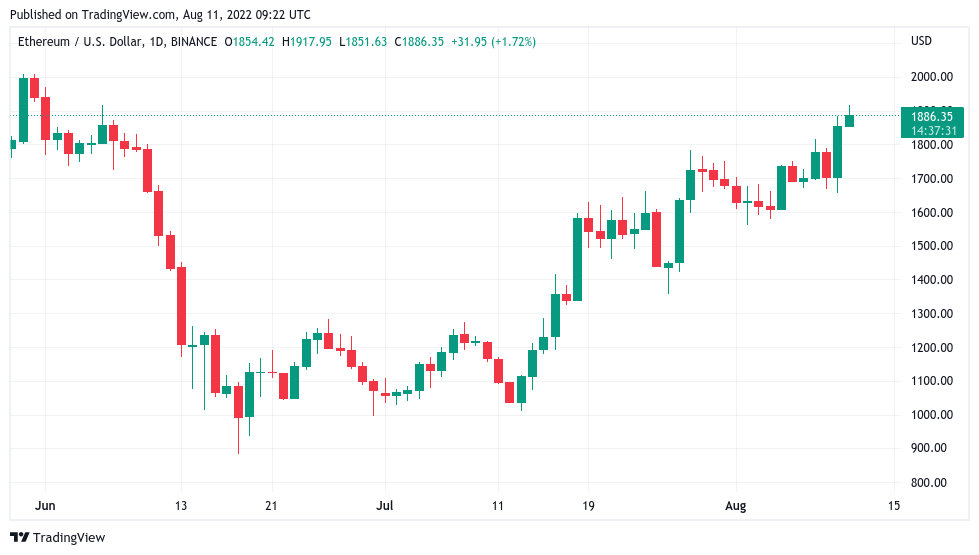
ETH/USD 1-day candle chart (Binance). Source: TradingView
Author

Cointelegraph Team
Cointelegraph
We are privileged enough to work with the best and brightest in Bitcoin.



