Bitcoin at $19,000: How to trade the pauze
-
Will price be able to break above the key resistance? Or is the uptrend over and ready for a reversal?
-
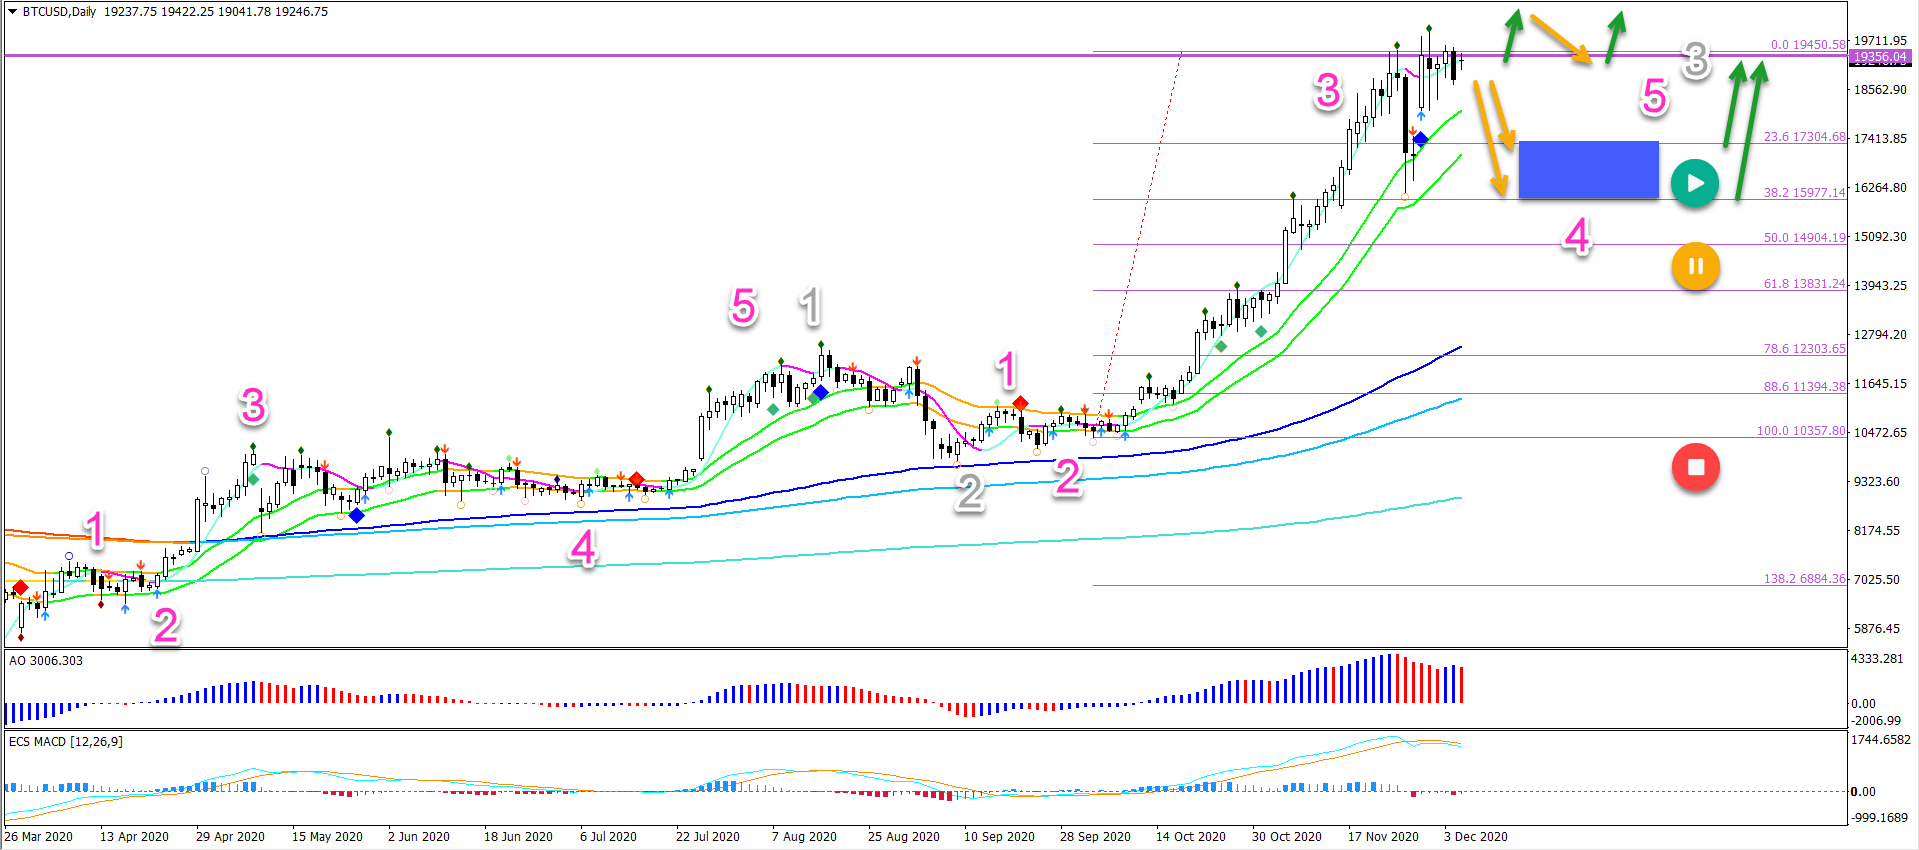
Bitcoin has been testing the previous top around $19,000 for 10 daily candles in a row. But so far, the bulls have not succeeded to break it.
-
The BTC/USD’s hesitation to break could indicate an extended wave 4. In that case, price action is expected to test the shallow Fibonacci retracement levels.

Price Charts and Technical Analysis
The BTC/USD’s hesitation to break could indicate an extended wave 4 (pink). In that case, price action is expected to test the shallow Fibonacci retracement levels.
A bullish bounce is expected at those Fibs and support zone (blue box). This is a significant confirmation… Why?
-
Because it would indicate the development of a larger wave 3 (grey) and uptrend continuation.
-
A break below the 50% Fibonacci level would pauze (yellow circle) the trend temporarily and a very deep reversal would invalidate it (red circle).
The other likely scenario is an immediate breakout above the previous top. In that case, it would be good to see a break, pullback and continuation. This pattern helps avoid false breakouts. Plus there is also a round level resistance at the $20,000 mark.
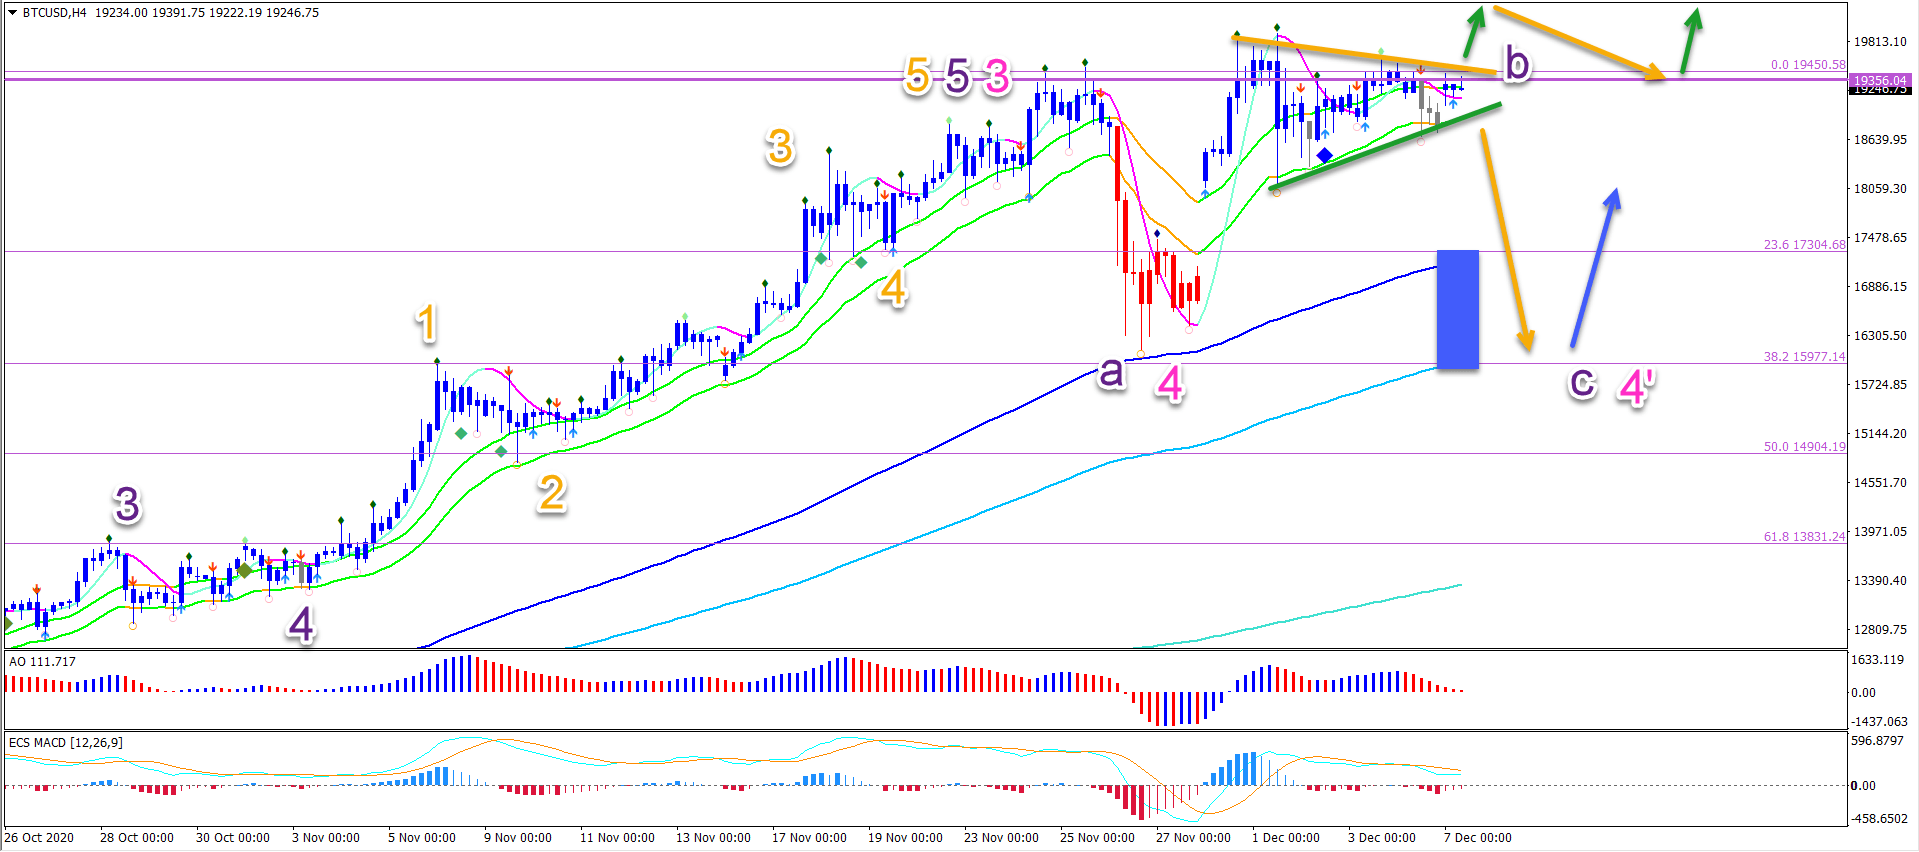
On the 4 hour chart, a break below the support trend line (green) confirms the extension of the wave 4 (pink 4’). The pattern is then completing a bearish ABC pattern (purple).
A bullish breakout should see a break, pullback, and continuation pattern. Otherwise the break remains vulnerable to a deeper retracement.
The analysis has been done with the ecs.SWAT method and ebook.
Author

Chris Svorcik
FS method
Chris Svorcik is a trader, analyst, and educator with over 15 years of experience in financial markets, specializing in moving averages, market structure, and price patterns.


