Bitcoin Analysis, Volatility Quelled, What’s Next

Market Cycles and Expectations

Bitcoin, once known for it’s volatility has been trading in a constricted range and is currently at -2.14% as of this morning. Chart formations display a conundrum of indirection, yet momentum over the past 8 weeks has shifted elsewhere in the market.
Intra-day charts demonstrate a no-trade zone. Oscillators and on-balance volume dictate that it’s too soon for a divergence. ADX is at neither a peak nor a trough, and moving average cross-overs have proven unproductive.
In this article I’ll highlight what to expect in terms of market cycles, and what could be around the corner for BTC.
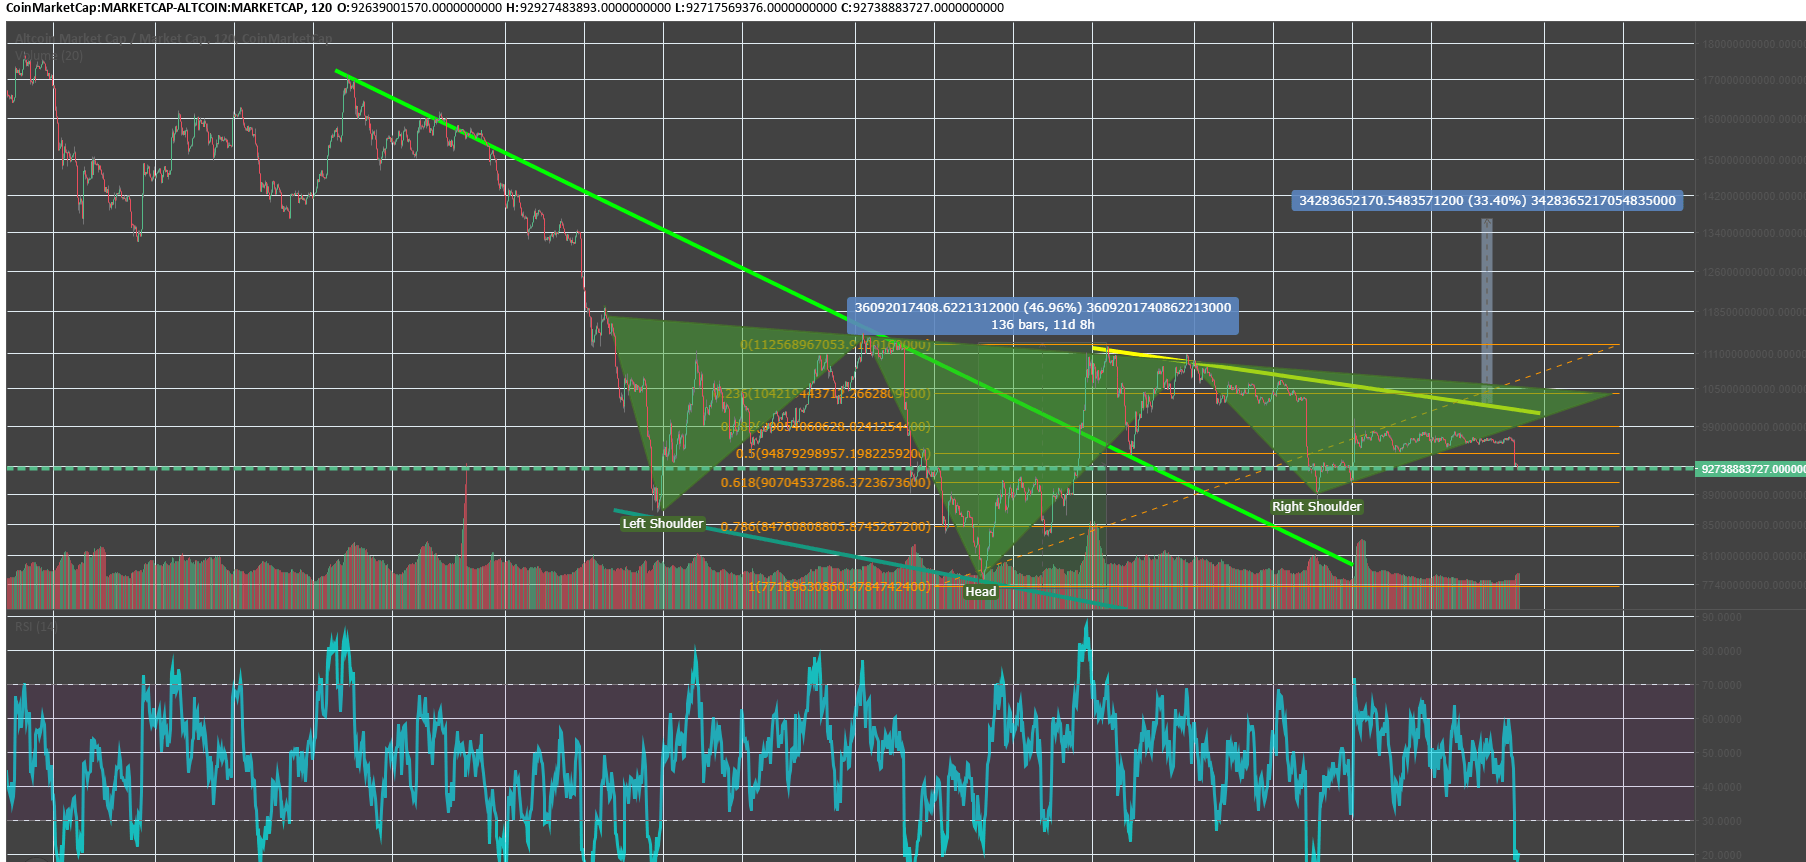
Above chart is of the Altcoin Market Cap, excluding BTC. Since 9/13/18, the Altcoin cap has rallied some 47%, then experienced a 61.8% retracement, only to show force in the form of a secondary rally.
Also present on the chart is an incomplete inverse Head and Shoulder formation. With a potential upside target of 33%.
The previous BTC sell-off on October 11th did, in turn, instigate a sell-off in Altcoin cap, and today’s -2.14% is also having an impact. Yet, currently Altcoin cap is holding above the 6.18% Fibonacci level. More importantly Bitcoin’s reduced volatility shifted momentum towards alts, as many tokens experienced rallies, and others “bull runs”.
In terms of market cycles, the sudden rally in Altcoins can be a precursor to an incoming BTC rally, as fundamentals are likely to shift momentum and volatility in favor of BTC bulls with the upcoming introduction of BAKKT, the institutional, spot only, Bitcoin futures settled the next day. This will provide much exposure to the asset, without the ability to short sell.
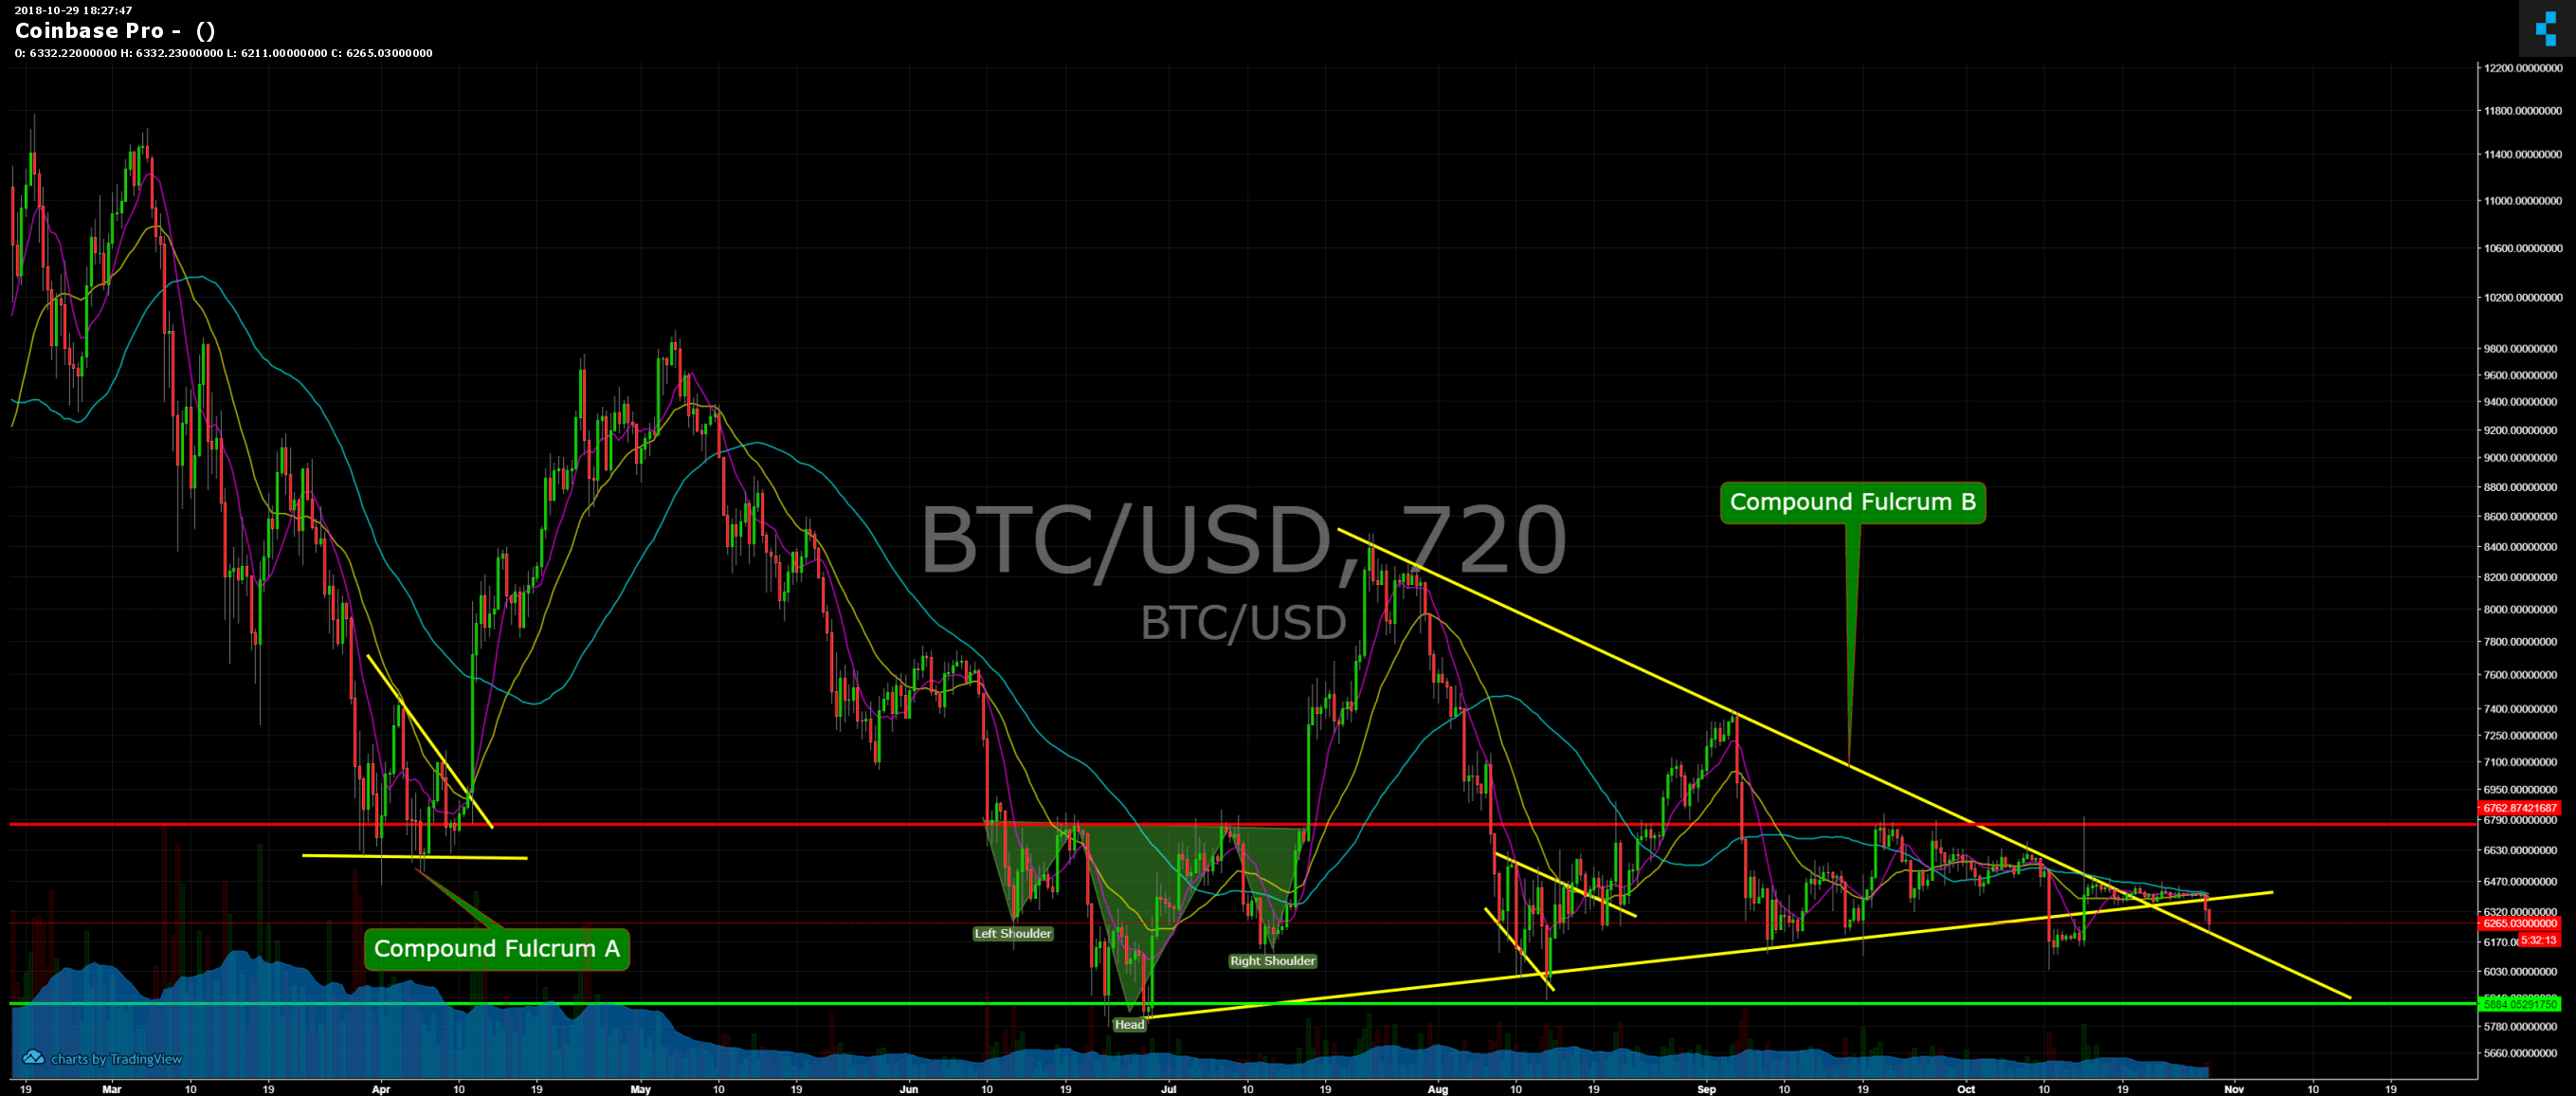
The above chart displays three reversal formations, and the current Compound Fulcrum, (CF, B) on the chart could be paving the way for a bullish turn.
April’s compound fulcrum set the currency into a 45%, 30-day relief rally. The month-long June through July Inverse Head and Shoulders formation was followed by a 25% rally, and the August descending broadening wedge, a 16% rally.
Three reversal formations, yet BTC is currently trading below each of their respective, neckline and throwback, support zones.
Critical Support Zones: $6,151, $5,967, and $5,799
Resistance Zone: $6,759
The bull scenario: Likely to come to life with the crack of resistance at $6,759.
The bear scenario: Bitcoin must breach previous swing lows, highlighted above as critical support zones.
With traditional markets experiencing a sell-off, all market participants appear on edge, and reluctant to buy a dip, whether correlation exists or not. The case for volume on BTC has been in steady decline. BAKKT might just be the much needed volume catalyst. Historically Altcoin rallies either precede a Bitcoin rally or follow one.
Author

George Saber
Coin Observatory
Influenced by high net-worth clients from previous ventures, George Saber began trading and analyzing markets in 2014. Upon doing so he took on Technical Analysis to better maneuver the market.


