- Binance Coin price delays its breakout from the head-and-shoulders pattern.
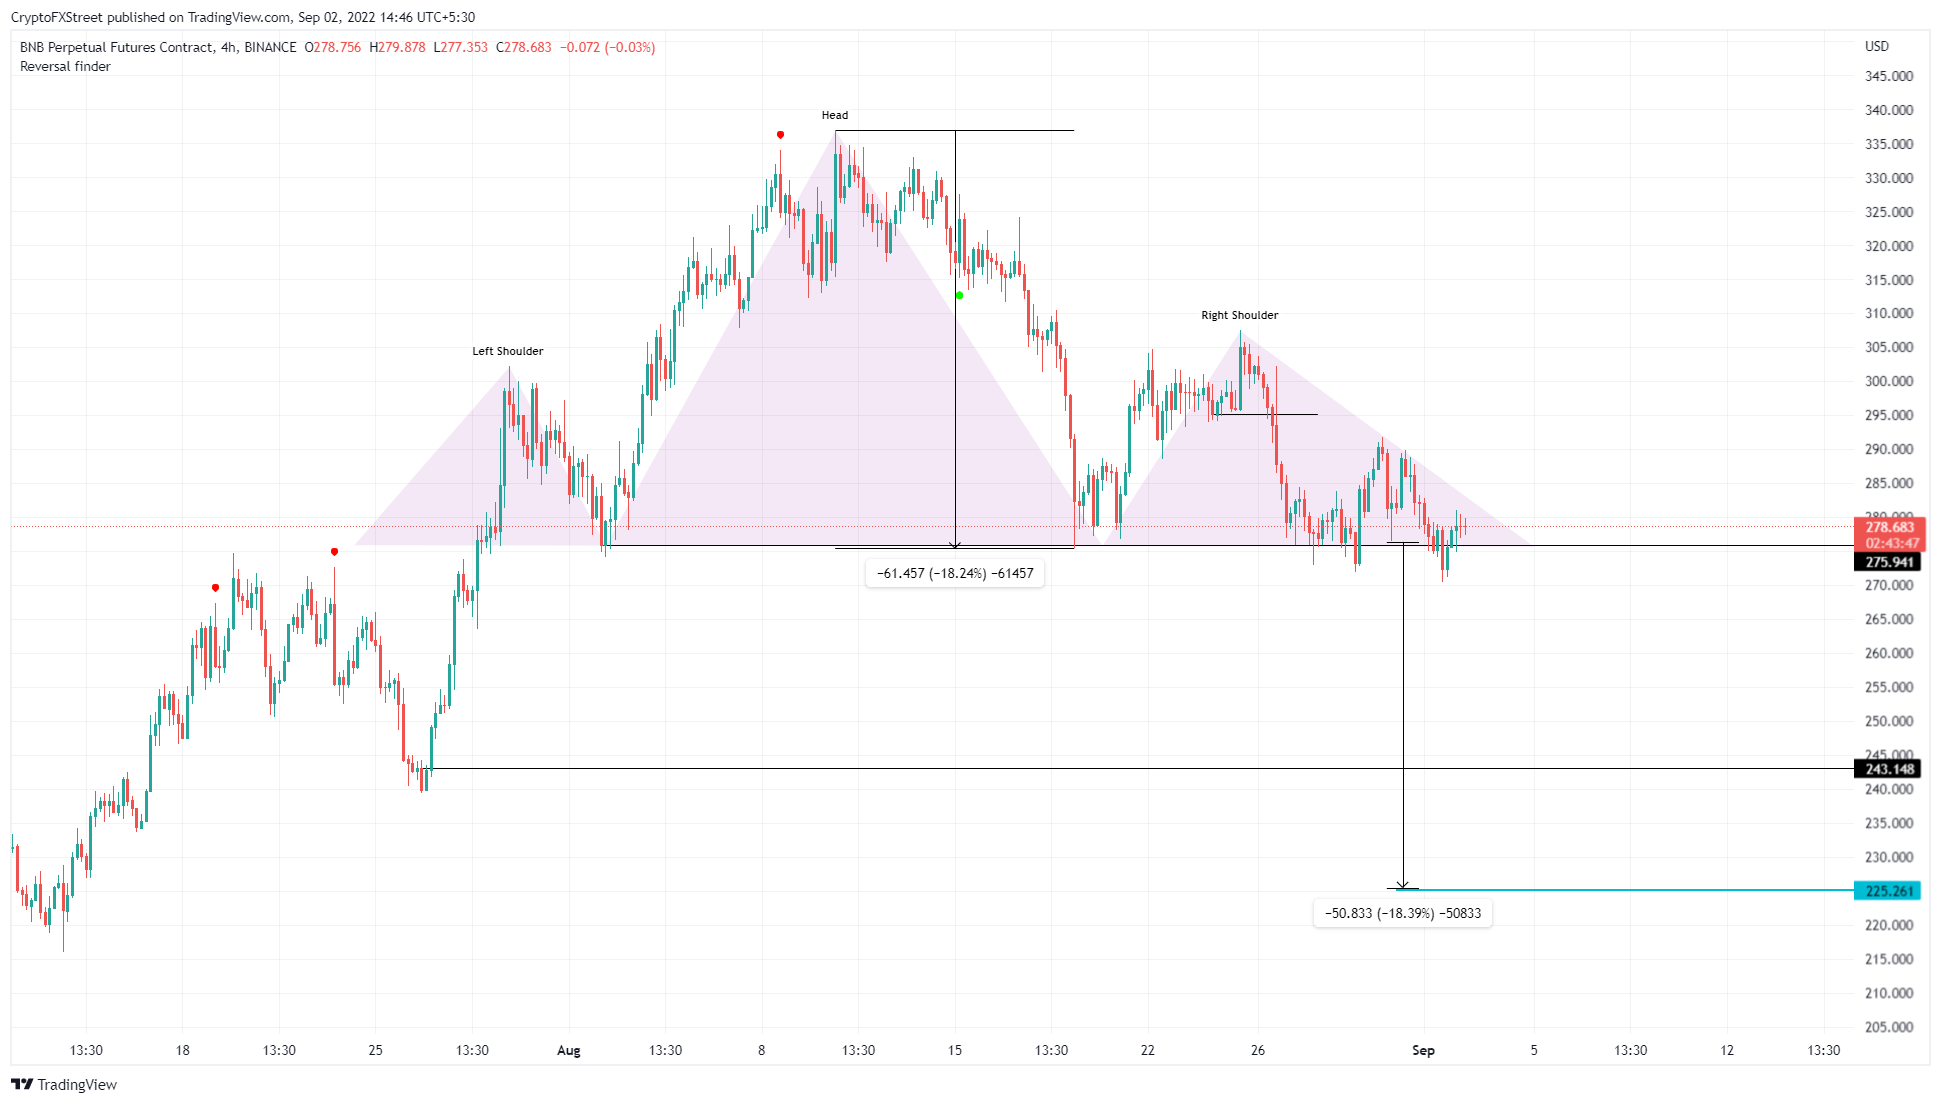
- A breakdown of the neckline at $275.94 reveals forecasts of an 18% crash to $225.26.
- A daily candlestick close above $307.5 will create a higher high and invalidate the bearish thesis.
Binance Coin price is at an inflection point which could result in a steep correction if sellers take control. However, buyers are also in a position where they can seize control and reverse the trend.
Binance Coin ready for big moves
Binance Coin price has formed a bearish reversal pattern since July 23. This technical formation is known as a head-and-shoulders pattern and contains three swing highs, with the central one being the tallest (the head) and the ones on either side shorter and of comparable height (the shoulders).
The swing lows of these peaks can be connected using a horizontal trend line, which forms a neckline. A break below the neckline is a signal for traders to go short. Although Binance Coin price tried breaking below the neckline on September 1, the buyers stepped in and triggered a frenzy of bullish momentum.
This move has postponed the bearish outlook. Regardless, the setup forecasts an 18% downswing to $225.26, obtained by measuring the height of the central peak and adding it to the breakout point at the neckline.
This puts the target for Binance Coin price at $225.26, but investors need to pay attention to the $243.14 support barrier which could prematurely halt the sell-off.
BNB/USDT 1-day chart
While things are looking gloomy for Binance Coin price, a hasty move from buyers that triggers a bounce from the neckline at $275.94 could sidestep the bearish fate.
The buyers could take this one step further and create a higher high relative to $294.20, which will not only indicate a weakness for bears but also invalidate the bearish thesis. This development could further see Binance Coin price attempt a recovery rally all the way up to $336.
Information on these pages contains forward-looking statements that involve risks and uncertainties. Markets and instruments profiled on this page are for informational purposes only and should not in any way come across as a recommendation to buy or sell in these assets. You should do your own thorough research before making any investment decisions. FXStreet does not in any way guarantee that this information is free from mistakes, errors, or material misstatements. It also does not guarantee that this information is of a timely nature. Investing in Open Markets involves a great deal of risk, including the loss of all or a portion of your investment, as well as emotional distress. All risks, losses and costs associated with investing, including total loss of principal, are your responsibility. The views and opinions expressed in this article are those of the authors and do not necessarily reflect the official policy or position of FXStreet nor its advertisers. The author will not be held responsible for information that is found at the end of links posted on this page.
If not otherwise explicitly mentioned in the body of the article, at the time of writing, the author has no position in any stock mentioned in this article and no business relationship with any company mentioned. The author has not received compensation for writing this article, other than from FXStreet.
FXStreet and the author do not provide personalized recommendations. The author makes no representations as to the accuracy, completeness, or suitability of this information. FXStreet and the author will not be liable for any errors, omissions or any losses, injuries or damages arising from this information and its display or use. Errors and omissions excepted.
The author and FXStreet are not registered investment advisors and nothing in this article is intended to be investment advice.
Recommended Content
Editors’ Picks
Ripple's move above this key level could trigger nearly 50% rally for XRP
Ripple has overcome a critical resistance level and flipped into a support floor on the weekly time frame. This development happened while XRP tightly consolidated for roughly 250 days. Investors can expect XRP to kickstart a massive rally.
Optimism price outlook with nearly $90 million worth of OP tokens flooding markets on Friday
Optimism volatility has shrunk in the ours leading to the network’s cliff unlock. It joins the likes of dYdX and Sui, which have similar events on their calendars. As token unlocks are often considered bearish catalysts, investors should brace for a reaction after the event.
Top 3 Price Prediction Bitcoin, Ethereum, Ripple: Retail watches from the sidelines with a bias for shorts
Bitcoin could clear $73,777 peak as BTC bulls resurface. Ethereum might fall 10% before next leg up as ETH RSI teases with sell signal. XRP could lose $0.6000 threshold as Ripple bulls fail to show up.
Jito price could hit $6 as JTO coils up inside this bullish pattern
Jito price action shows a potential cup and handle formation. Based on theoretical measurement rules, a successful breakout could yield a 56% rally to $6.0. A breakdown of the $3.86 support level would create a lower low for JTO and invalidate the bullish thesis.
Bitcoin: BTC may have recovered, but is it out of the woods?
Bitcoin’s (BTC) upward momentum has shown a significant decline for the past two weeks or so. This development led to a bearish signal on the weekly and an uncertain outlook on the monthly.