Binance Coin price keeps close to pattern framework, while BNB triggers buy signal
- Binance Coin price tags all-time high but fails to gain traction.
- Symmetrical triangle breakout estimates a measured move of 35%.
- Daily active addresses plummet during latest rebound.

Binance Coin price projects a measured move of 35% from the symmetrical triangle trigger price. Today’s first breakout attempt proved to be indecisive, leaving BNB to drift back into the pattern.
Binance Coin price on pace for the fourth-best month since 2017
April was an exciting month for the cryptocurrency market, highlighted by several 50% declines. BNB also fell with the collective sell-off, but its performance on a relative basis was striking and paved the way for today’s breakout.
Binance Coin price is currently up 99.71% for April, making it the fourth-best monthly return since July 2017 and the sixth consecutive positive month. The altcoin is also on pace to close the week up 20%. The numbers reflect tremendous relative strength and position BNB as a leader if the broad rebound continues in the cryptocurrency market.
At the moment, CoinMarketCap shows a BNB market capitalization of $92 billion, the third-largest cryptocurrency, suggesting it would be in the spotlight, but that is not the case. The digital token has quietly outlined a symmetrical triangle pattern with a measured move target of just over 35%, targeting a price of $847.25 from the current position of the triangle’s upper trendline. The target correlates closely with the 161.8% Fibonacci extension of the April decline at $827.48.
The April 12 high at $643.37 offered some stubborn resistance earlier today and remains the critical barrier to Binance Coin price reaching the measured move target. Beyond $827.48, speculators need to consider the 261.8% extension of the 2019-2020 bear market at $932.62.
Big game hunters can target the 261.8% extension of the February crash at $1,124.11.
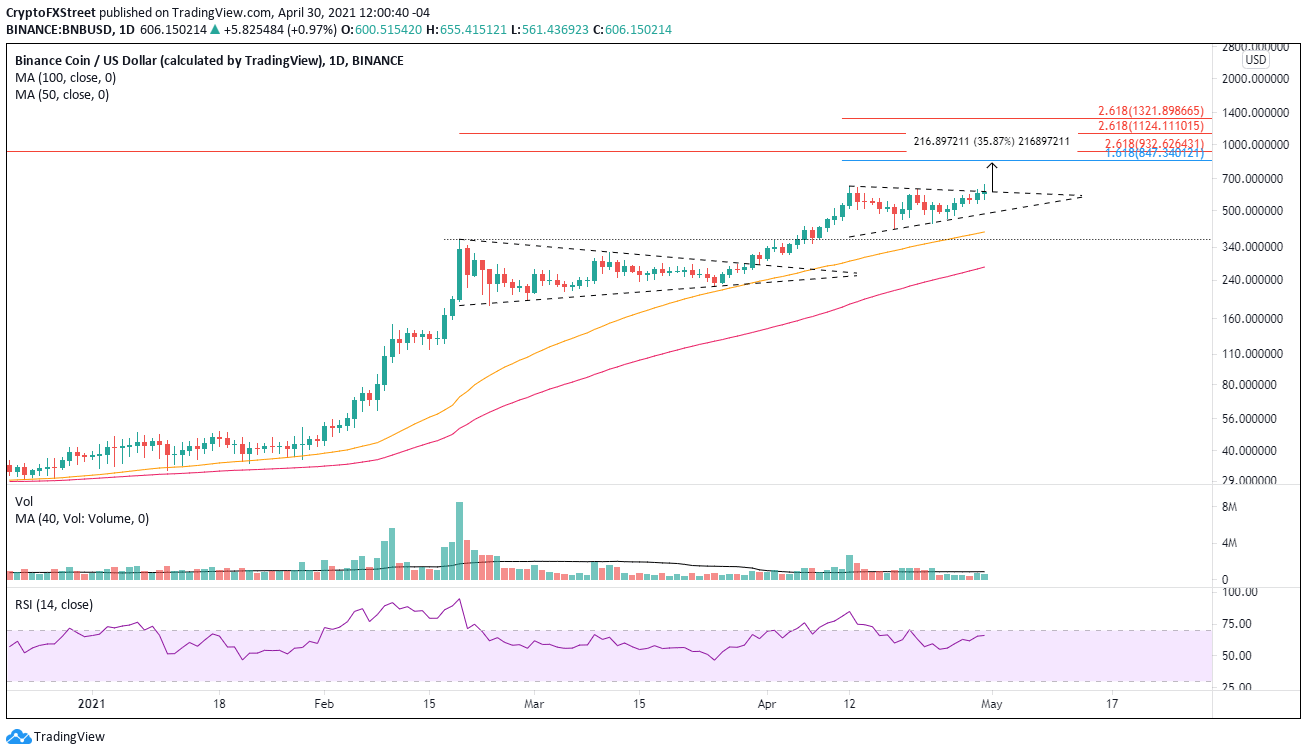
BNB/USD daily chart
In February and April, the crypto space has reminded market operators of the need for sound risk management preparations. A failure of the breakout would flip attention to support. Critical support begins at the triangle’s lower trend line at $484.68, followed by the 50-day simple moving average at $399.35 and the February high at $368.17.
To corroborate the importance of solid risk management in any investment methodology, the number of daily active addresses has fallen from a high of 313.4K on April 20 to 57.9K as of today, representing an 80% decline. A bearish development considering that BNB was on the doorstep of an all-time high.
The sharp decline in addresses connecting to the BNB network illustrates a general exodus of speculators based on profit-taking or a simple reallocation of funds. Moreover, it implies that Binance Coin price may need to reset inside the triangle before achieving a sustainable breakout.
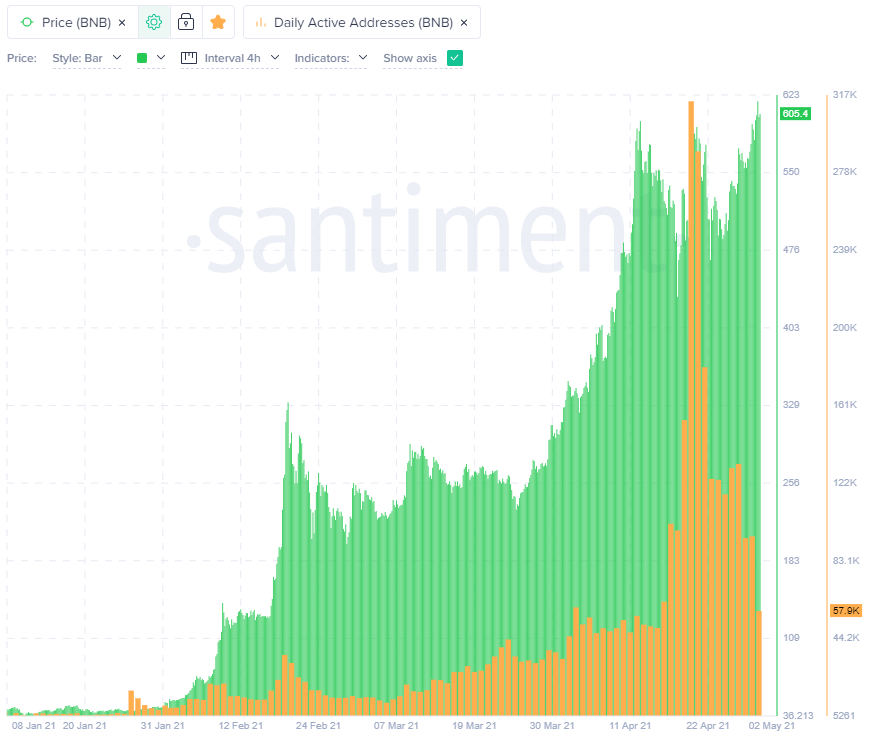
BNB daily active addresses
The technical evidence reinforces a bullish BNB outlook, but the on-chain metric of daily active addresses does raise caution regarding the altcoin’s intentions in the immediate future.
Author

Sheldon McIntyre, CMT
Independent Analyst
Sheldon has 24 years of investment experience holding various positions in companies based in the United States and Chile. His core competencies include BRIC and G-10 equity markets, swing and position trading and technical analysis.



