Binance Coin price guards gains ahead of a potential 41% bullish breakout


  • Binance Coin price crosses the $290 stubborn resistance to exchange hands at $296.
  • BNB is moving closer to a potential ascending triangle breakout to $470.
  • The 50-day SMA is in line to back BNB price’s bid for a significant move north.

Binance Coin price is following up with its push for a sustainable rebound from support formed at $262. Despite the overarching losses experienced over the last three weeks, higher BNB prices suggest that the path of the least resistance will remain upward.

Binance Coin price flaunts a possible 41% move to $470

Binance Coin price’s daily chart reveals an ascending triangle pattern forming, which, if validated, could see a massive bullish breakout to $470. As BNB’s governing pattern matures, consolidation is expected near the apex.

It is worth mentioning that short-term declines may occur before the actual rally, but the hypotenuse will safeguard the Binance Coin price uptrend. Traders should wait until the price cracks the x-axis at $335 before signing up for the 41% jump.
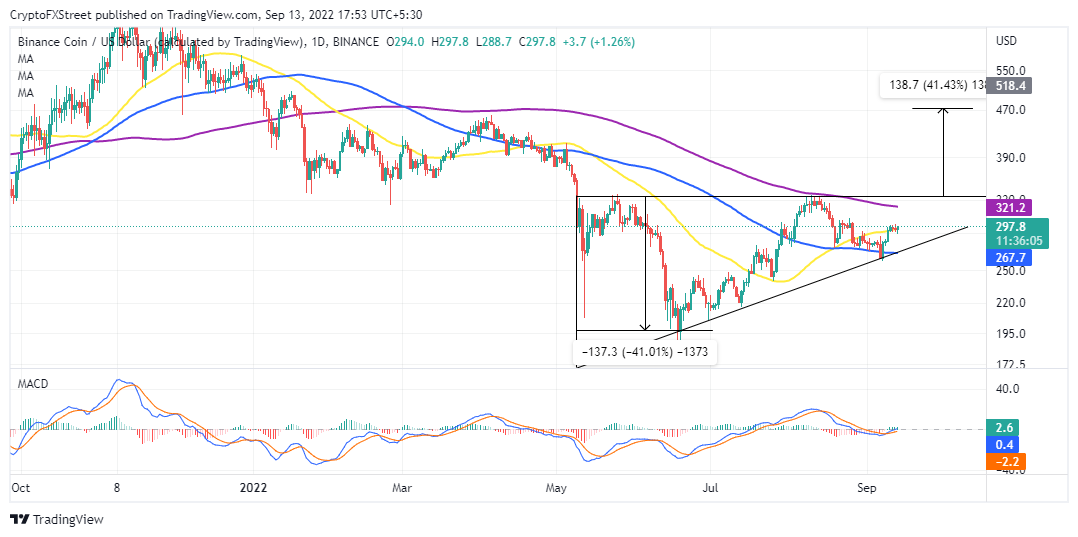
 BNB/USD daily chart

BNB/USD daily chart

The Moving Average Convergence Divergence (MACD) recently presented a buy signal on the same daily chart. Buyers returned to the market as the 12-day Exponential Moving Average (EMA) crossed above the 26-day EMA – bolstering a sharp ascent to $296.

On the other hand, traders should take note of the position of the market value realized value (MVRV), an on-chain metric by Santiment, because profit taking may slow down Binance Coin price’s quest for a bullish outcome. From the chart below, the MVRV ratio stands at 31.88% above the mean line.

The last time this metric moved above the mean line, it tagged 42.81%, followed by a sharp drop in BNB price from $330 to the buyer congestion at $262. Therefore, it will not be strange to see Binance Coin price retreat before climbing the ladder again.

 BNB MVRV ratio

Binance Coin MVRV metric

Nevertheless, Binance Coin price will likely carry on with the higher low pattern (ascending triangle) till a breakout is confirmed above the x-axis. Besides, the 100-day SMA (blue) may provide a safety net and relieve investors if overhead pressure rises. For now, a daily close above the 50-day SMA (yellow) is what may perhaps reinforce the uptrend.


Information on these pages contains forward-looking statements that involve risks and uncertainties. Markets and instruments profiled on this page are for informational purposes only and should not in any way come across as a recommendation to buy or sell in these assets. You should do your own thorough research before making any investment decisions. FXStreet does not in any way guarantee that this information is free from mistakes, errors, or material misstatements. It also does not guarantee that this information is of a timely nature. Investing in Open Markets involves a great deal of risk, including the loss of all or a portion of your investment, as well as emotional distress. All risks, losses and costs associated with investing, including total loss of principal, are your responsibility. The views and opinions expressed in this article are those of the authors and do not necessarily reflect the official policy or position of FXStreet nor its advertisers. The author will not be held responsible for information that is found at the end of links posted on this page.

If not otherwise explicitly mentioned in the body of the article, at the time of writing, the author has no position in any stock mentioned in this article and no business relationship with any company mentioned. The author has not received compensation for writing this article, other than from FXStreet.

FXStreet and the author do not provide personalized recommendations. The author makes no representations as to the accuracy, completeness, or suitability of this information. FXStreet and the author will not be liable for any errors, omissions or any losses, injuries or damages arising from this information and its display or use. Errors and omissions excepted.

The author and FXStreet are not registered investment advisors and nothing in this article is intended to be investment advice.

Join Telegram

Recommended content


Recommended Content

Editors’ Picks

Ethereum dips slightly amid Renzo depeg, BlackRock spot ETH ETF amendment

Ethereum dips slightly amid Renzo depeg, BlackRock spot ETH ETF amendment

Ethereum (ETH) suffered a brief decline on Wednesday afternoon despite increased accumulation from whales. This follows Ethereum restaking protocol Renzo restaked ETH (ezETH) crashing from its 1:1 peg with ETH and increased activities surrounding spot Ethereum ETFs.

More Ethereum News

Injective price weakness persists despite over 5.9 million INJ tokens burned

Injective price weakness persists despite over 5.9 million INJ tokens burned

Injective (INJ) price is trading with a bearish bias, stuck in the lower section of the market range. The bearish outlook abounds despite the network's deflationary efforts to pump the price. Coupled with broader market gloom, INJ token’s doomed days may not be over yet.

More Injective News

US intensifies battle against crypto privacy protocols following crackdown on Samourai Wallet

US intensifies battle against crypto privacy protocols following crackdown on Samourai Wallet

CEO Keonne Rodriguez and CTO William Lonergan of Samourai Wallet were arrested by the US Department of Justice (DoJ) on Wednesday and charged with $100 million in money laundering on a count and illegal money transmitting on another count. This move could see privacy-focused cryptocurrencies take a dip.

More Cryptocurrencies News

Near Protocol Price Prediction: NEAR fulfills targets but a 10% correction may be on the horizon

Near Protocol Price Prediction: NEAR fulfills targets but a 10% correction may be on the horizon

Near Protocol price has completed a 55% mean reversal from the bottom of the market range at $4.27. Amid growing bearish activity, NEAR could drop 10% to the $6.00 psychological level before a potential recovery. A break and close above $7.95 would invalidate the downleg thesis.

More Near Protocol News

Bitcoin: BTC post-halving rally could be partially priced in Premium

Bitcoin: BTC post-halving rally could be partially priced in

Bitcoin (BTC) price briefly slipped below the $60,000 level for the last three days, attracting buyers in this area as the fourth BTC halving is due in a few hours. Is the halving priced in for Bitcoin? Or will the pioneer crypto note more gains in the coming days? 

Read full analysis

BTC

ETH

XRP