Binance Elliott Wave technical analysis [Video]
BNB/USD Elliott Wave technical analysis
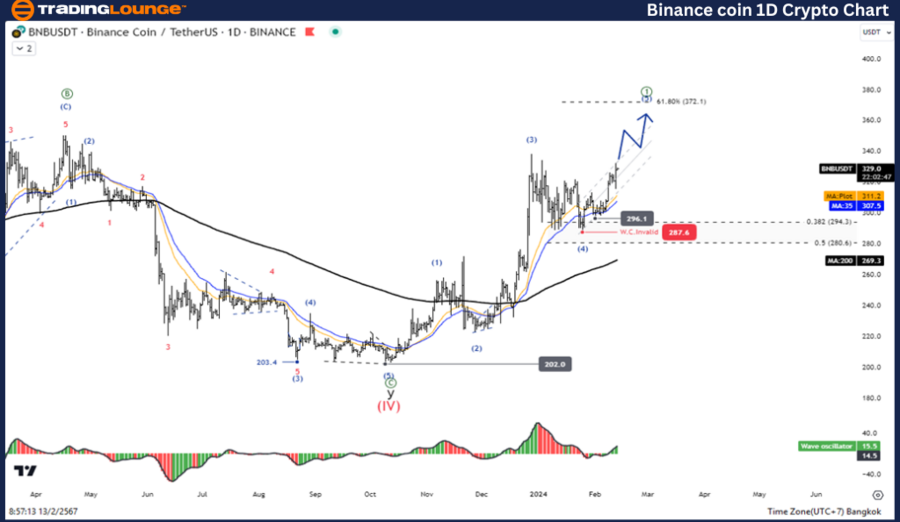
Function: Follow Trend.
Mode: Motive.
Structure: Impulse.
Position: Wave ((v)).
Direction next higher degrees: wave 3.
Wave cancel invalid level: 287.5.
Details: Wave ((V)) is equal to wave ((1) at 734.4.
BNB/USD trading strategy
It looks like Wave IV has finished correcting. And the price is rising again in Wave V. Wave V usually has the same length as Wave I. Therefore, we predict the trend of Wave V has a chance to test the 0734.4 level before correcting again.
Binance/ U.S. dollar(BNBEUSD)Technical Indicators: The price is above the MA200 indicating an Uptrend, Wave Oscillator is a bullish Momentum.
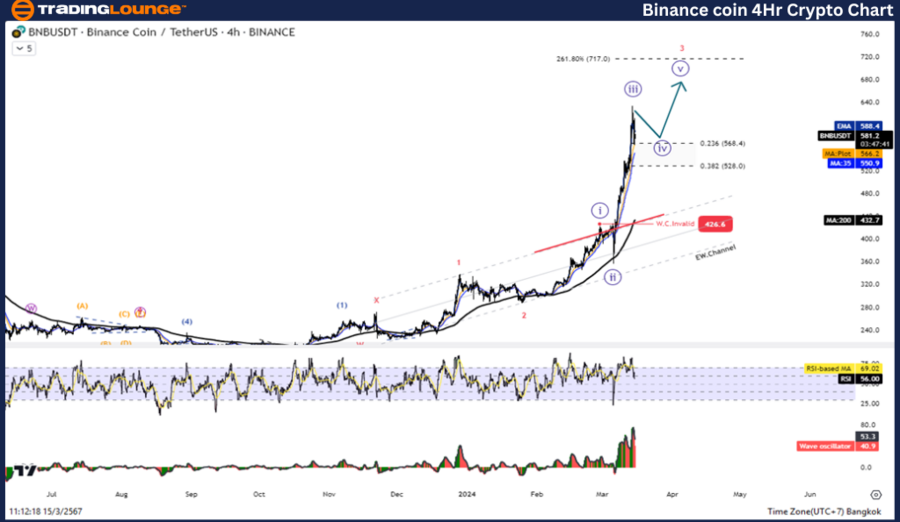
BNB/USD Elliott Wave technical analysis
Function: Follow Trend.
Mode: Motive.
Structure: Impulse.
Position: Wave ((v)).
Direction next higher degrees: Wave 3.
Wave cancel invalid level: 287.5.
Details: Wave ((V)) is equal to wave ((1) at 734.4.
BNB/USD trading strategy
It looks like Wave IV has finished correcting. And the price is rising again in Wave V. Wave V usually has the same length as Wave I. Therefore, we predict the trend of Wave V has a chance to test the 0734.4 level before correcting again.
Binance/ U.S. dollar(BNBEUSD)Technical Indicators: The price is above the MA200 indicating an Uptrend, Wave Oscillator is a bullish Momentum.
Binance Elliott Wave technical analysis [Video]
Author

Peter Mathers
TradingLounge
Peter Mathers started actively trading in 1982. He began his career at Hoei and Shoin, a Japanese futures trading company.