‘Big move brewing’ for BTC price? Bitcoin may stay flat, hints analyst

Bitcoin (BTC $16,819) traders are desperate for fresh BTC price volatility, but opinions are diverging on when it will come.
BTC/USD is currently seeing some of the least volatile conditions in its history, price metrics show.
Volatility far from guaranteed
Since the FTX crisis, Bitcoin has settled into a historically narrow trading range which refuses to budge.
Despite macro triggers, low-volume holiday trading and a yearly candle close, BTC price action has stuck rigidly to a zone focused on $17,000.
This is the least volatile period in the history of the Bitcoin historical volatility index (BVOL), and other data likewise shows that such sideways behavior is extremely rare.
Two months after FTX, traders and analysts alike are hotly debating when the breakout will come for BTC/USD — and in which direction it will go.
“A big move is brewing for Bitcoin,” Charles Edwards, founder and CEO of asset manager Capriole Investments, stated on Jan. 5:
Bitcoin is currently trading at a major low in volatility. Generally, when Bitcoin breaks out of extremely low volatility, the ensuing trend tends to last. Don’t fight the trend on the next major move.
An accompanying chart showed the 30-day annualized standard deviation of Bitcoin volatility, this now at lows seen only a handful of times in the past five years.
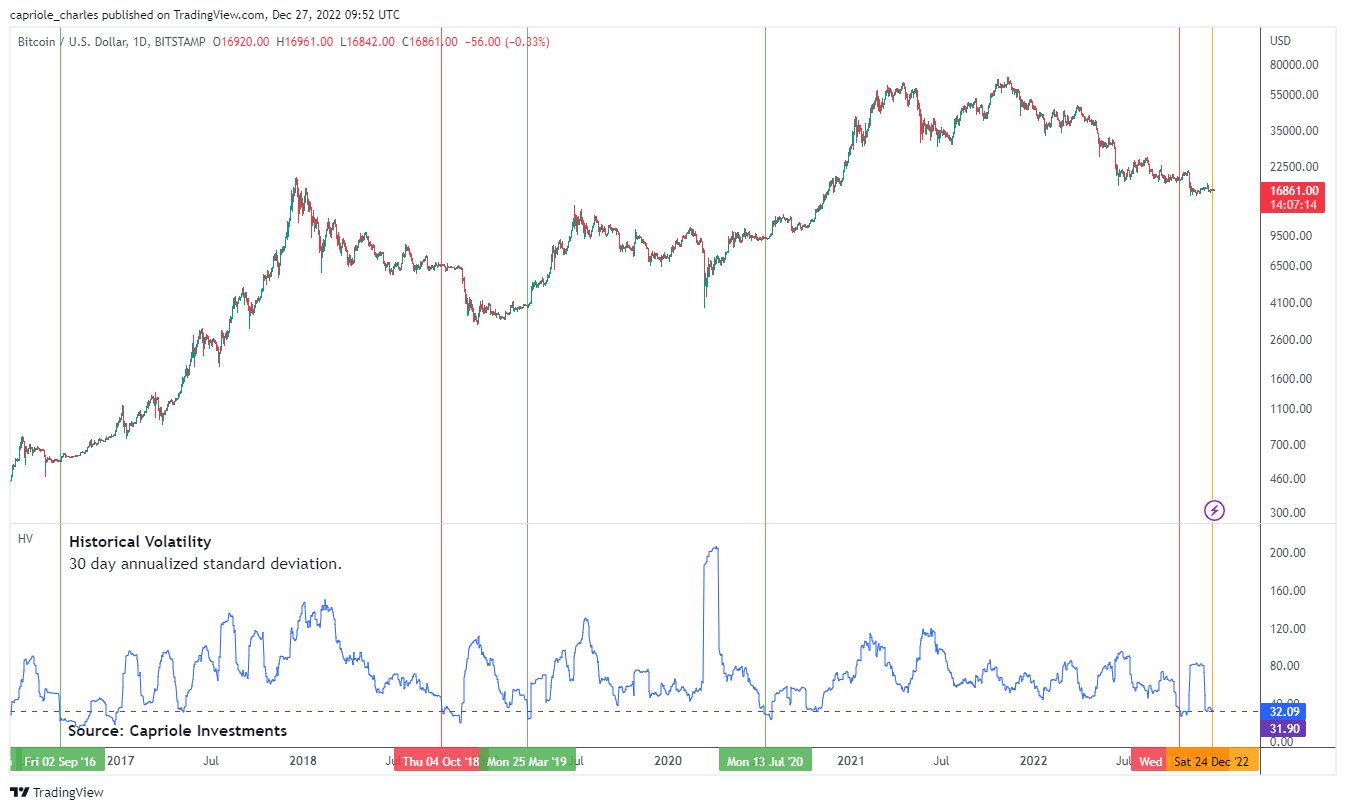
BTC/USD annotated chart. Source: Charles Edwards/ Twitter
Equally convinced that the status quo will break is Wolf of All Streets podcast host Scott Melker, who this week flagged what he described as the “tightest” Bollinger Bands he had ever seen on the daily Bitcoin chart.
Bollinger Bands are a classic volatility indicator in action since the 1980s. They likewise use standard deviation to determine the upper and lower bounds of price action within a defined period. Multiple use cases arise, including the ability to assess comparatively volatile or nonvolatile price action, as well as associated entry and exit points.
Currently, the two bands are “squeezed” around the central moving average on BTC/USD, data from Cointelegraph Markets Pro and TradingView shows, leading to assumptions that volatility should now ensue.
For creator John Bollinger, however, the length of the squeeze is not necessarily pertinent to the timing or strength of future volatility.
“In my experience prolonged Squeezes are rarely valuable signals. I prefer Squeeze and Go!” he responded to Melker.
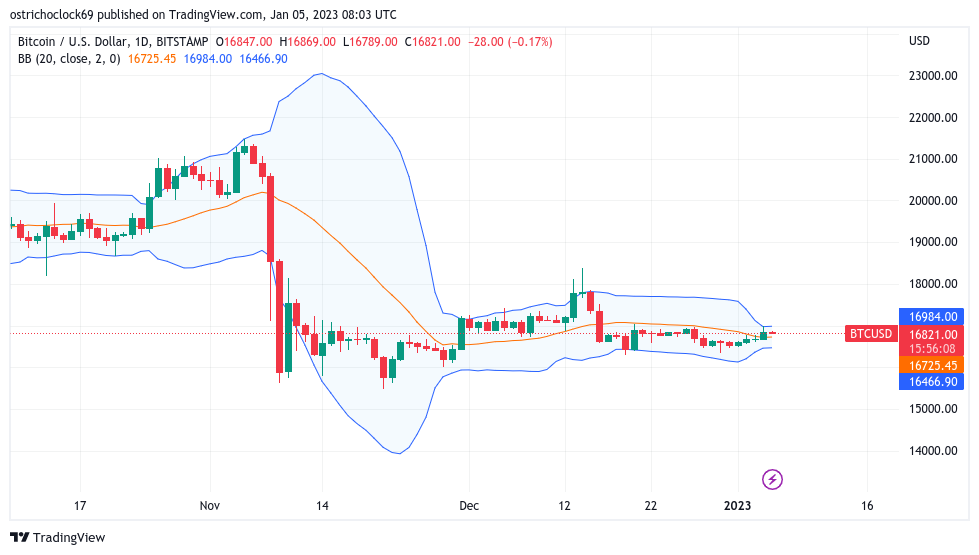
BTC/USD 1-day candle chart (Bitstamp) with Bollinger bands. Source: TradingView
Bullish Bitcoin takes lacking
As Cointelegraph reported, meanwhile, there is no shortage of bearish BTC price predictions in force at the start of 2023.
Various warnings have cautioned hodlers over what may be to come, including a drop to $10,000 or even lower in Q1.
Hopes of upside are comparatively muted as analysts look to see what will happen with the United States’ macroeconomic policy and its influence on risk assets.
Author

Cointelegraph Team
Cointelegraph
We are privileged enough to work with the best and brightest in Bitcoin.


