Best Bitcoin price prediction for today: Binance denies it's being shut down in Japan
- BTC/USD still on its path, money comes in the $8400 mark
- Binance denies the claims that Japanese regulator (FSA) has inquired them

Asian trading has opened with news coming from Nikkei about the FSA (Japanese financial regulator) warning Binance of irregular activities in Japan. Less than two hours later, the company has denied having received any notification from the FSA, accusing Nikkei of publishing fake news. Such announcement has triggered a 4% dip in the BTC/USD, towards the $8350.
BTC/USD 1H chart
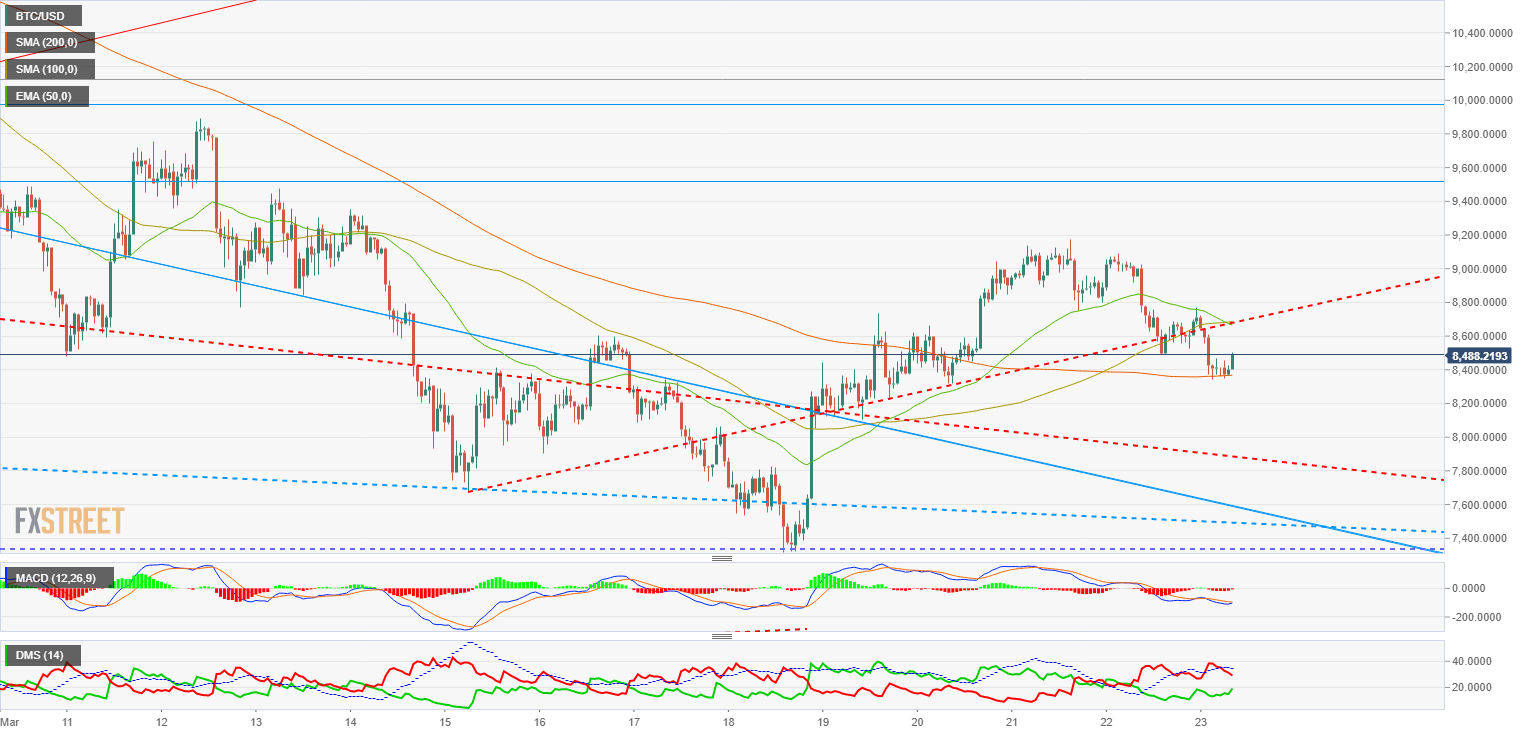
Our Bitcoin analysis starts with the 1-hour chart, where the price action shows a pretty standard setup. BTC/USD has traded lower down to where the 200-SMA is sitting, reversing its path to the upside there. Such respect for a meaningful support is positive for the main Cryptocurrency. Main moving averages are converging, which is tightening the price range and triggering short-term moves.
As we can see in the chart, the 100-SMA has a clearly positive slope, while the 200-SMA has started turning to the upside, a profile not shown since last March 3rd. Bitcoin price action and moving averages are developing around a trendline that comes from March 15th and that now rules the bullish move.
In the short-term, Bitcoin finds support in the mentioned 200-SMA, around the $8350 mark, and only if that level is broken it would go back to the $8100 area, the support from previous trading sessions.
On the bullish side, the 100-SMA and the 50-EMA are trading between $8600 and $8750, so in case of breaking above, that price area could generate some volatility. Morevoer, the trendline that rules the action is also found in that area, so BTC/USD should not go back to a clearly bullish profile in such time frame until it breaks above $8800.
MACD in the Bitcoin 1-hour chart is configured to cross to the upside, but still below the 0 line. The small distance to such level confirms a scenario of a bull-bear tug of war in the short-term, meeting the existing resistances.
Directional Movement Index shows a certain buying interest, in the attempt to break above the 50-EMA before the yesterday's close and the 200-SMA support. Sellers have retrated in the last hours and are not backing the movement.
BTC/USD 4H chart
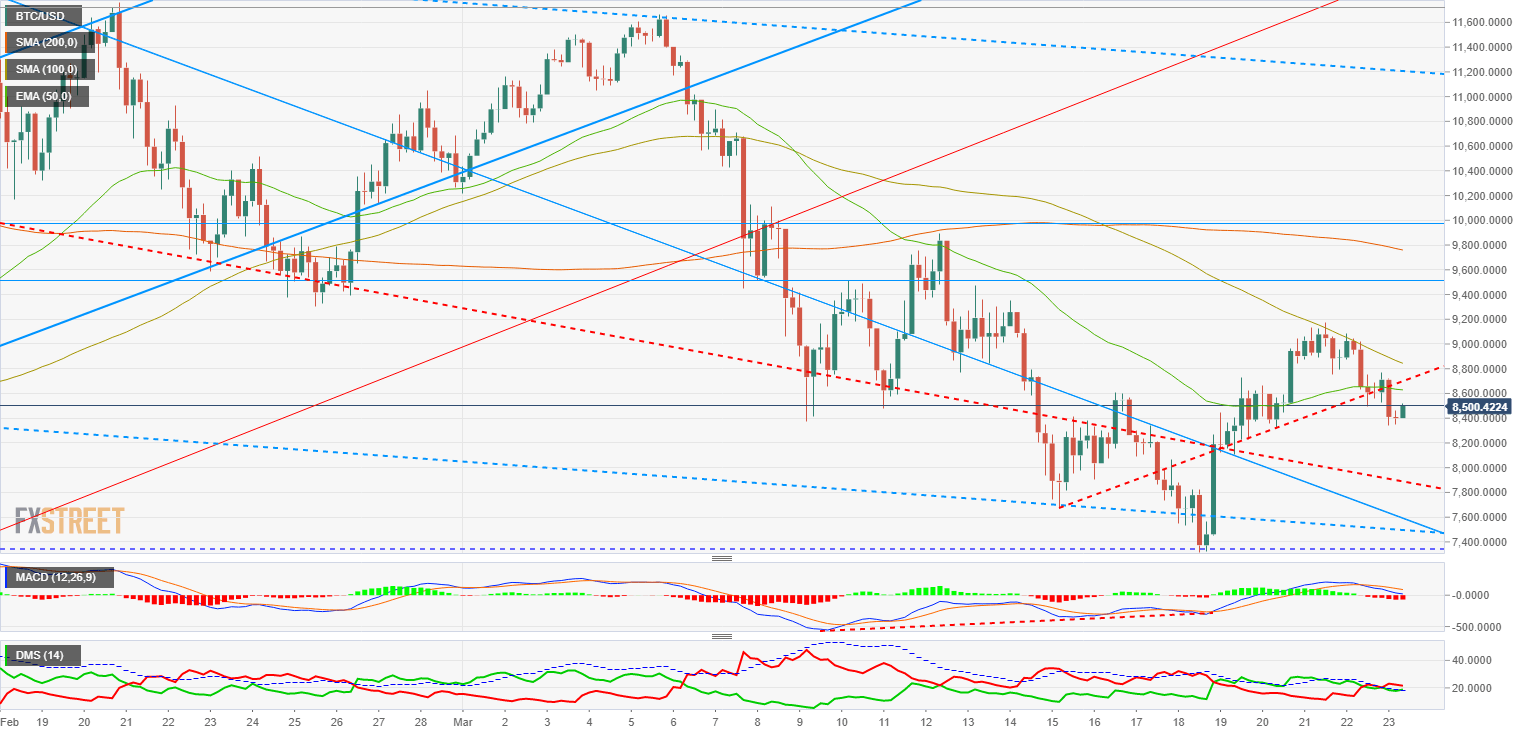
Bitcoin in the 4-hour chart has seen how the bullish profile diminishes, with just the technical indicators backing a bullish scenario. BTC price has left a Doji candle in the $8400, from where it has turned to the upside, developing an early bullish candle that should close at $8720 to draw a meaningful figure. Expect BTC/USD to meet the 50-EMA on its way to $8620.
To the upside, if that exponential average is broken, next stop will be at $8770, where BTC/USD will meet the 100-SMA and the trendline that rules the current movement. Further way up, resistances are at $8550 and the 200-SMA at the $9780.
The most important support is located at the $8400 mark. If that one is tested and fails, price would go back to the $8200 at first, to later continue on its way down to $7800 and $7450.
MACD in the Bitcoin 4-hour chart is trading above the equilibrium line, where it will probably turn to the upside if the 1-hour timeframe analysis weighs in notably.
Directional Movement Index is not showing the short-term reactions that we can see in the 1-hour chart. That time-frame shows equilibrium, with sellers slightly above buyers and the ADX just below the 20 level that indicates trend strength.
BTC/USD Daily chart
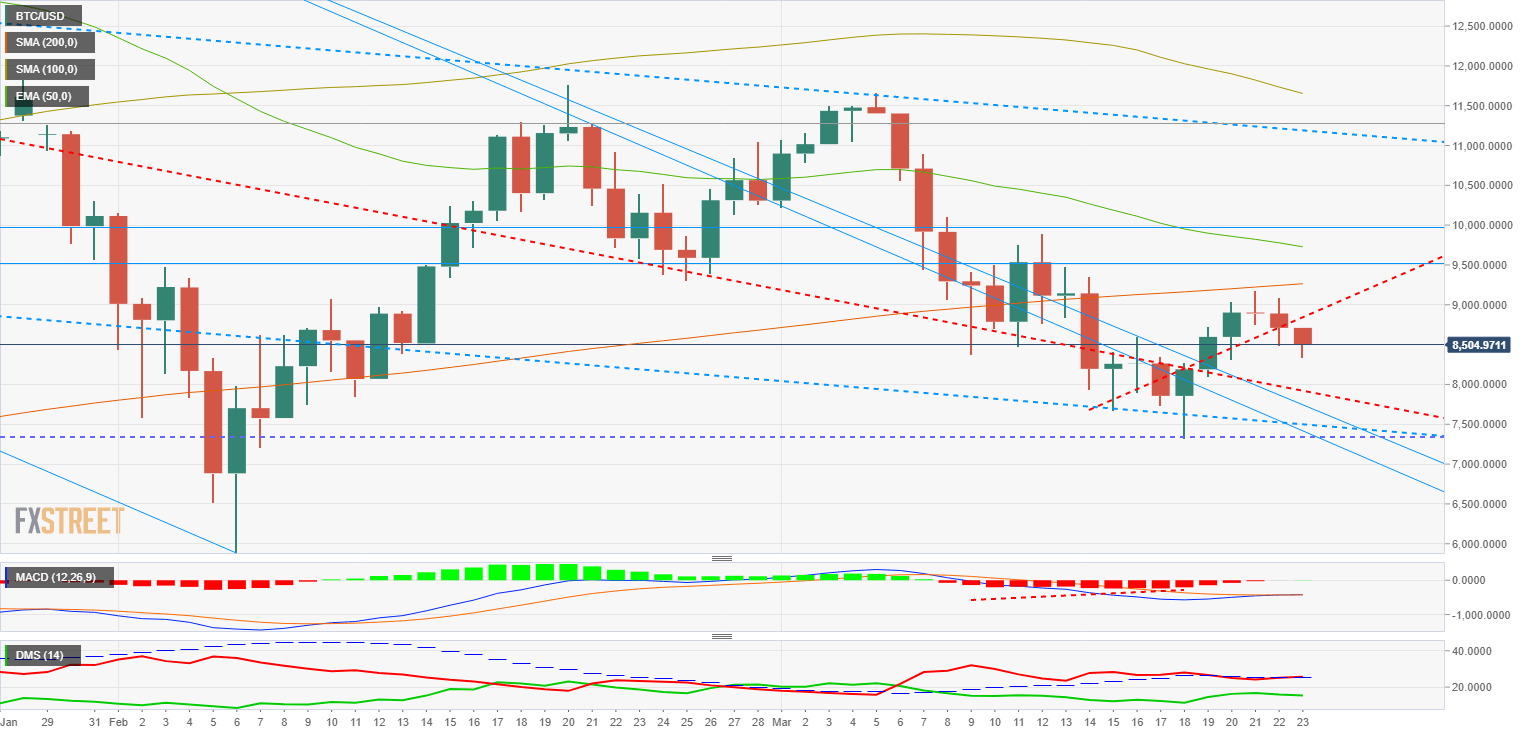
The daily chart shows a completely different profile, where the bearish bias dominates the scene. Bitcoin price has room to fall with no supports until the $7950 and $8000. If that price area is lost, multiple lines are drawn to the $6500 level. Another key level to watch is at $7340.
MACD in the Bitcoin daily chart shows a profile with barely any inclination, with the moving averages and the signal clustered in the same levels. That does not bring input about the direction, so it could be solved both to the upside and the downside.
Directional Movement Index in the daily chart shows the sellers in similar levels to the last trading sessions, while buyers are showing a rise from the lows of March 18th.
Conclusion
Bitcoin price looks to the upside, with probable rises that could impact the technical outlook in the 4-hour chart. More time and more bullish rides are needed to turn the daily chart from its current bearish setup, so the most probable scenario is one of moderate short-term rises that could trigger a bullish leg for some days. The retracement from that leg could be the one that decides the outlook of BTC/USD in the daily chart.
Author

Tomas Salles
FXStreet
Tomàs Sallés was born in Barcelona in 1972, he is a certified technical analyst after having completing specialized courses in Spain and Switzerland. He expanded his technical training following the guidance of great experts on the financial markets.


