BCH/USD Technical Analysis: Bearish breakout on the horizon
- Bears have overtaken the bulls in the BCH/USD market.
- Technical analysis shows that a bearish breakout is on the horizon.

BCH/USD daily graph
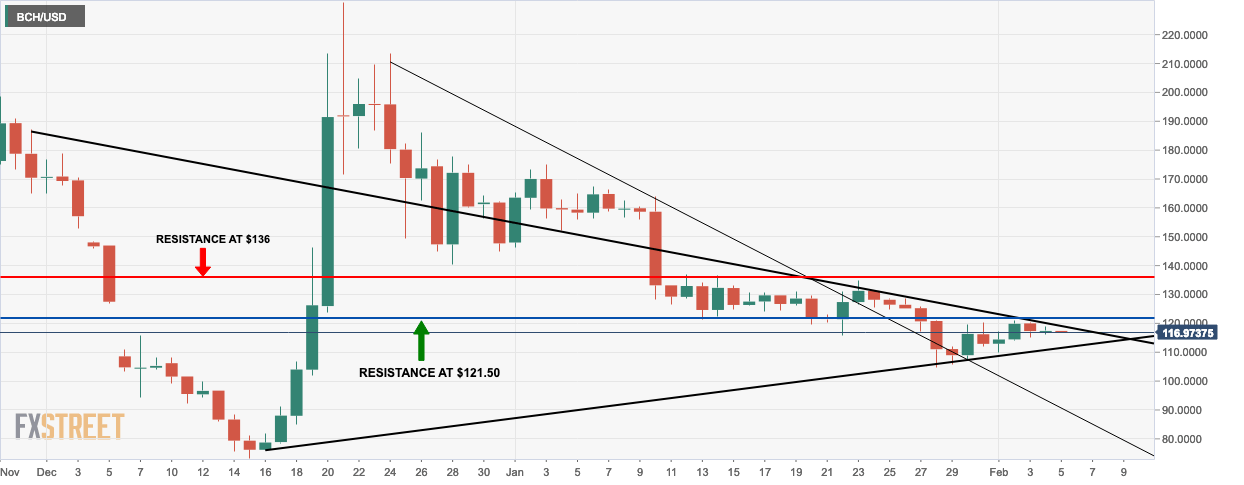
- The BCH/USD daily chart forms a triangle which is ripe for a breakout.
- Short-term resistance lies at $121.50 which the bulls need to break through.
BCH/USD 4-hour graph
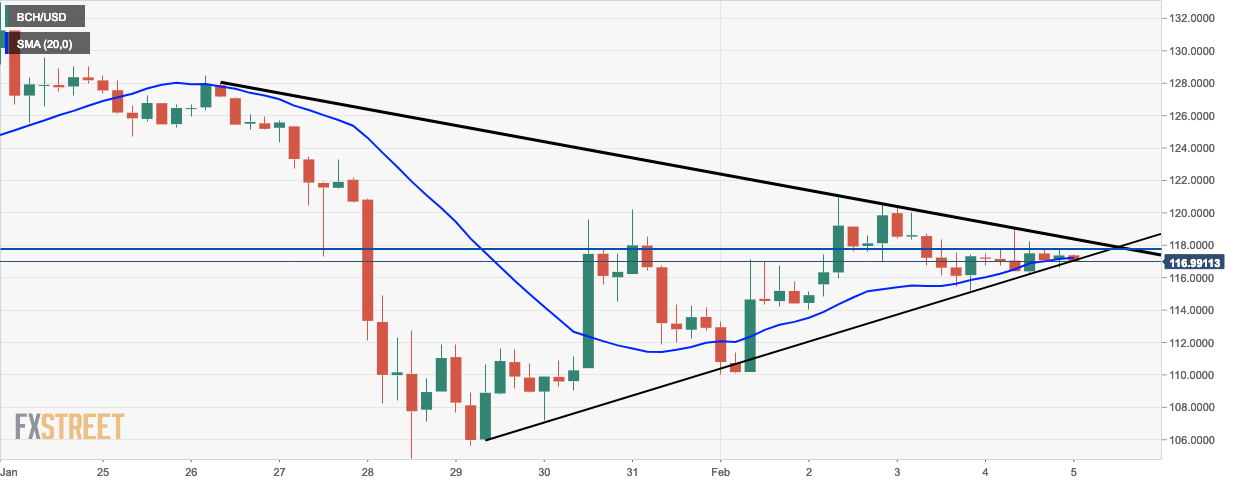
- The upward trending line has acted as strong support for the last 8 sessions.
- The 20-day simple moving average (SMA 20) curve is trending along the BCH/USD market and it looks like the curve will overtake the market soon. This indicates a bearish trend.
BCH/USD hourly graph
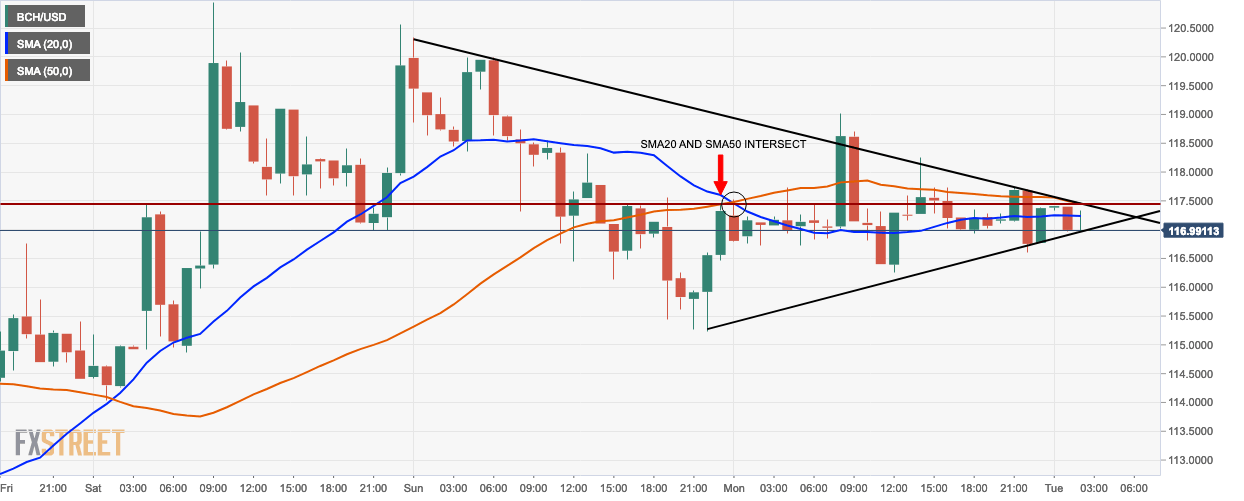
- The SMA 20 and SMA 50 curves cross over on Monday, February 4. This is an indicator of a bearish market.
- Bulls need to break through the resistance provided by the downward trending line to reverse the trend.
Key Levels
- Resistance 3: $121.6093
- Resistance 2: $120.3149
- Resistance 1: $118.8444
- Pivot Point: $117.5500
- Support 1: $116.0796
- Support 2: $114.7852
- Support 3: $113.3147
Author

Rajarshi Mitra
Independent Analyst
Rajarshi entered the blockchain space in 2016. He is a blockchain researcher who has worked for Blockgeeks and has done research work for several ICOs. He gets regularly invited to give talks on the blockchain technology and cryptocurrencies.
More from Rajarshi Mitra


