BCH/USD sentiment analysis: Market remains bearish as BCH/USD opens at $127 this Wednesday

BCH/USD daily chart
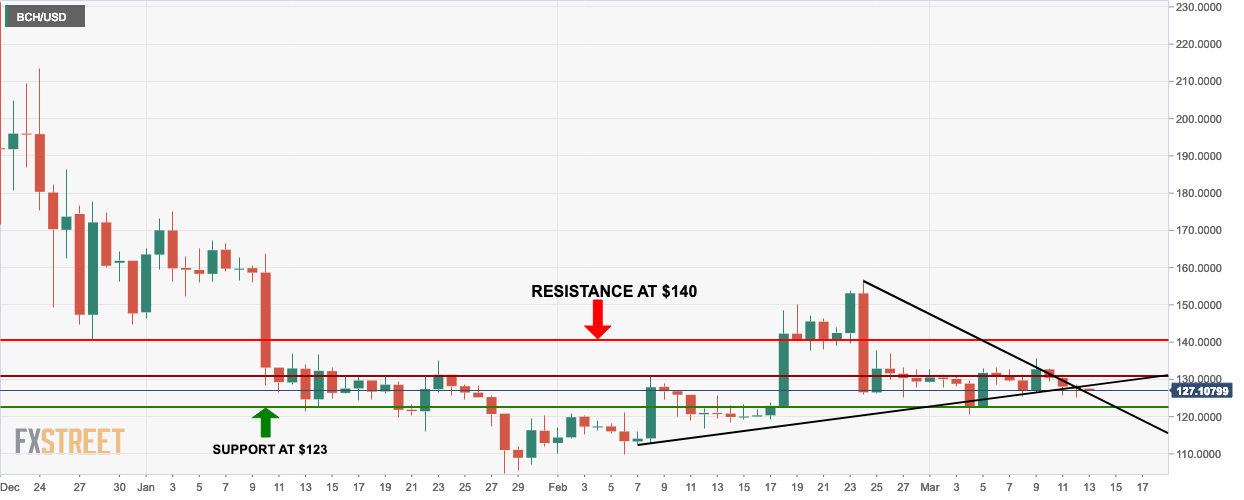
- BCH/USD has had a bearish breakout from a triangle formation.
- Bulls will need to defend immediate support which lies at $127.
BCH/USD 4-hour chart
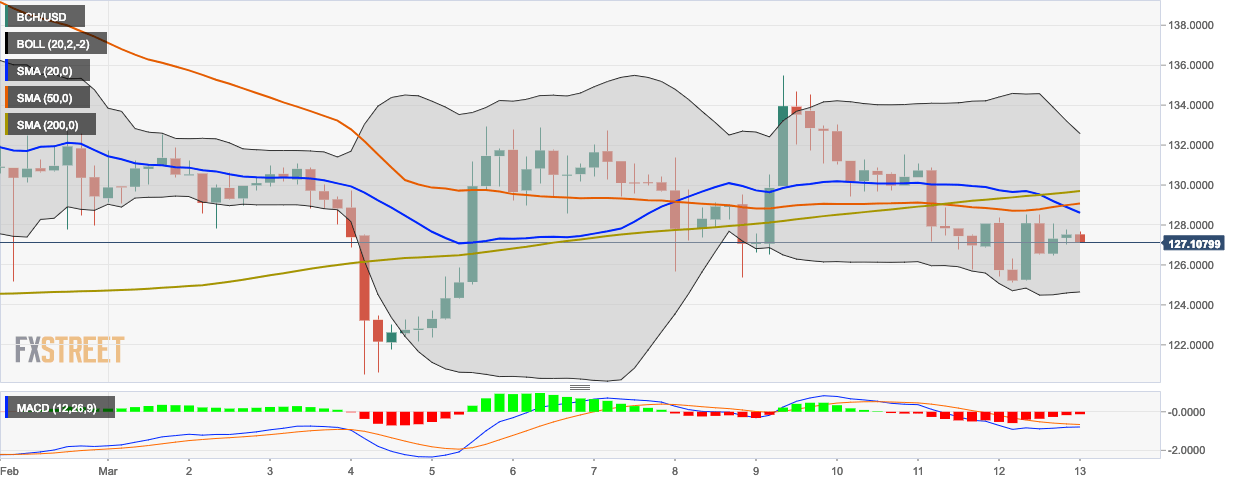
- The BCH/USD 4-hour chart is trending in the middle of the 20-day Bollinger band which indicates that the market is not strongly bearish.
- The 20-day simple moving average (SMA 20), SMA 50, and SMA 200 curves are all trending above the market, which indicates a bearish market.
- The SMA 200 has already crossed over the SMA 50 curve which is called a “death cross” and is a strong sell signal.
BCH/USD hourly chart
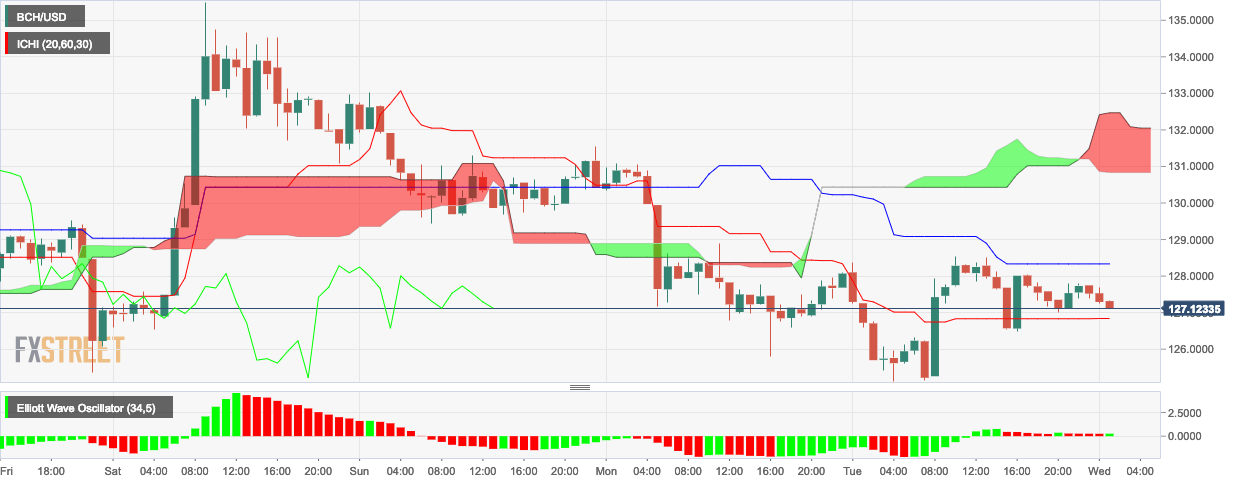
- The Ichimoku indicator shows an upcoming thick bearish cloud for the BCH/USD hourly market.
- The Elliot wave’s latest session is bullish even though majority sentiment remains bullish.
Key Levels
- Resistance 3: $132.4006
- Resistance 2: $130.4683
- Resistance 1: $128.9942
- Pivot Point: $127.0619
- Support 1: $125.5877
- Support 2: $123.6554
- Support 3: $122.1813
Author

Rajarshi Mitra
Independent Analyst
Rajarshi entered the blockchain space in 2016. He is a blockchain researcher who has worked for Blockgeeks and has done research work for several ICOs. He gets regularly invited to give talks on the blockchain technology and cryptocurrencies.
More from Rajarshi Mitra


