Band Protocol Price Prediction: BAND formed a bullish reversal pattern, targeting $10
- BAND seems to have formed an inverse head and shoulders pattern on the 4-hour chart.
- Bulls are eying up a potential price target at $10.

BAND is currently trading at $6.15, losing around 65% of its value since the peak at $17.97 on August 10. Nonetheless, the digital asset still holds a $126 million market capitalization and shows signs of a potential bullish reversal.
BAND aiming for a reversal, according to several indicators
Overall, it seems that the entire cryptocurrency market is turning bullish despite the recent FUD from various exchanges. Willy Woo, an expert in on-chain metrics, has posted a Tweet stating that the last announcement about OKEx locking withdrawals didn’t affect the market, which indicates we are in bull season.
BAND/USD 4-hour chart
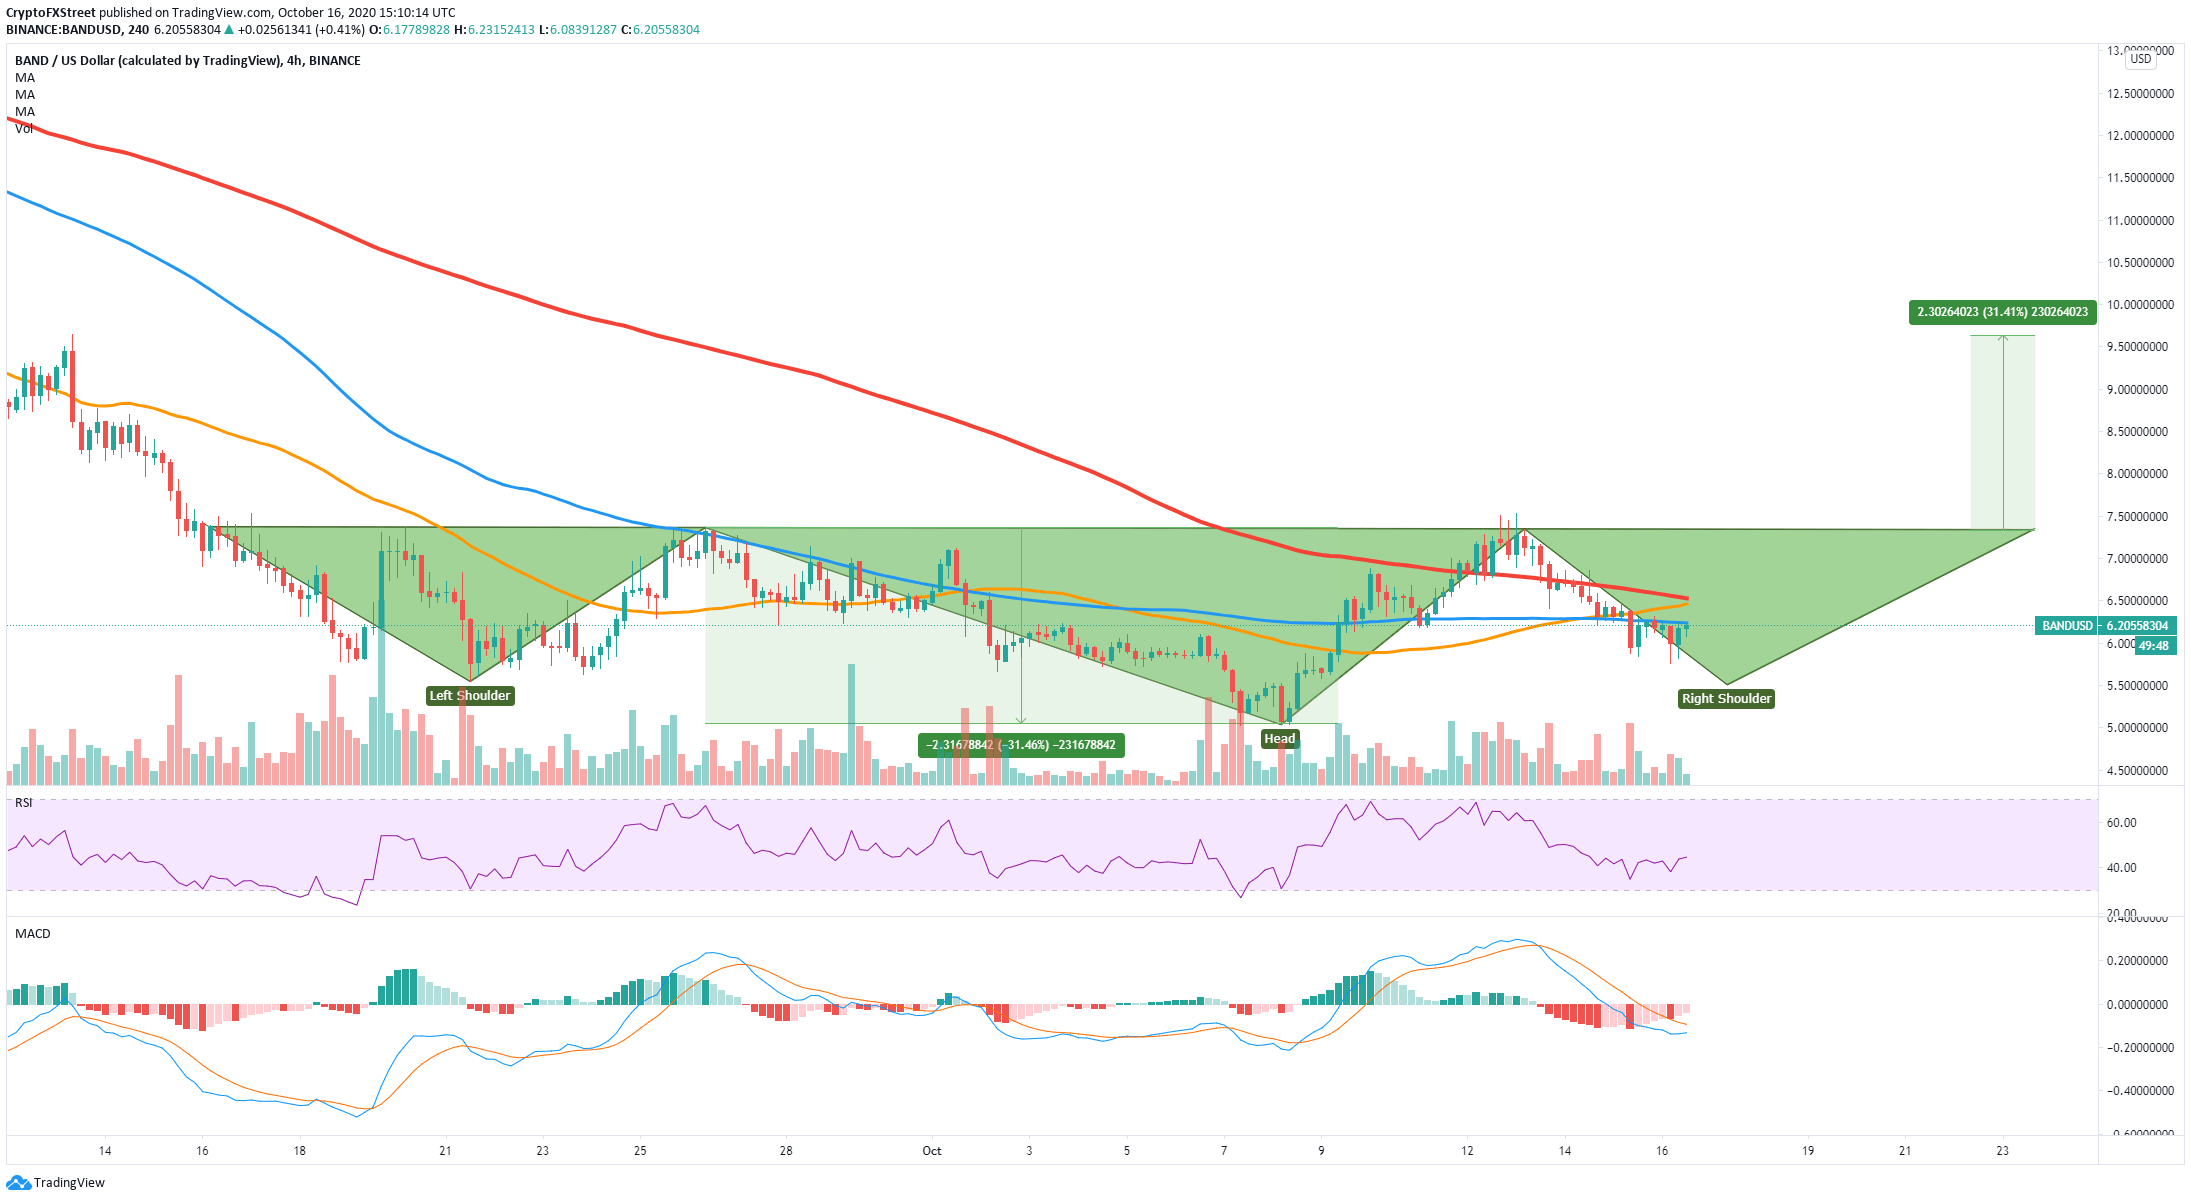
It looks like BAND could be forming the right shoulder of the inverse head and shoulders pattern. The most critical resistance level is $7.33, a bullish breakout above this level can potentially drive the price towards $10, using the length of the head of the pattern.
BAND IOMAP Chart
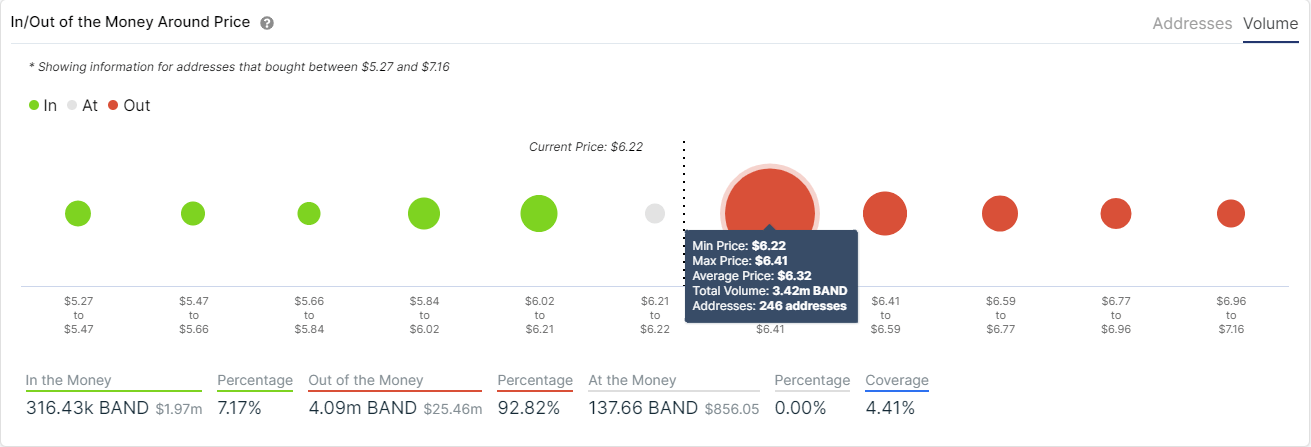
The MACD is slowly turning bullish, and the In/Out of the Money Around Price chart shows there is only one significant resistance area between $6.22 and $6.41, with 3.42 million BAND in volume. Above this point, the resistance is notably low in comparison, which means an initial breakout above $6.41 can push BAND to the $7.33 resistance.
BAND/USD 1-hour chart
-637384581111545536.png)
On the other hand, although the inverse head and shoulders pattern has potential, BAND faces several technical resistance levels. On the 1-hour chart, the 50-SMA is currently acting as a strong resistance point. The 200-SMA and the 100-SMA will also pose a threat to the bulls.
Additionally, observing the same IOMAP chart as above, we can notice a lack of support on the way down. A failure to hold the support level at $5.5 where the right shoulder is located, would most likely drive BAND towards the low of $5 and possibly even lower.
Crucial price points for investors
A bullish inverse head and shoulders pattern formed on the 4-hour chart signifies a potential reversal for BAND. A breakout above $6.41 can push BAND towards the baseline of the pattern at $7.33. Climbing above this point can lead the digital asset to $10.
Despite the bullish pattern, BAND seems to be facing several important resistance levels on the way up. A failure to hold the most critical support level established at $5.5 can easily take the digital asset down to the low of $5 and potentially even lower.
Author

Lorenzo Stroe
Independent Analyst
Lorenzo is an experienced Technical Analyst and Content Writer who has been working in the cryptocurrency industry since 2012. He also has a passion for trading.


