Band Protocol Price Prediction: BAND prepares for a major price breakout
- BAND daily chart has flashed the buy signal as per the TD Sequential indicator.
- The 12-hour chart is currently going through a consolidation phase preceding a price breakout.

BAND is presently consolidating its price in the 12-hour price chart, which has led to the Bollinger Band's squeezing.
BAND/USD 12-hour chart
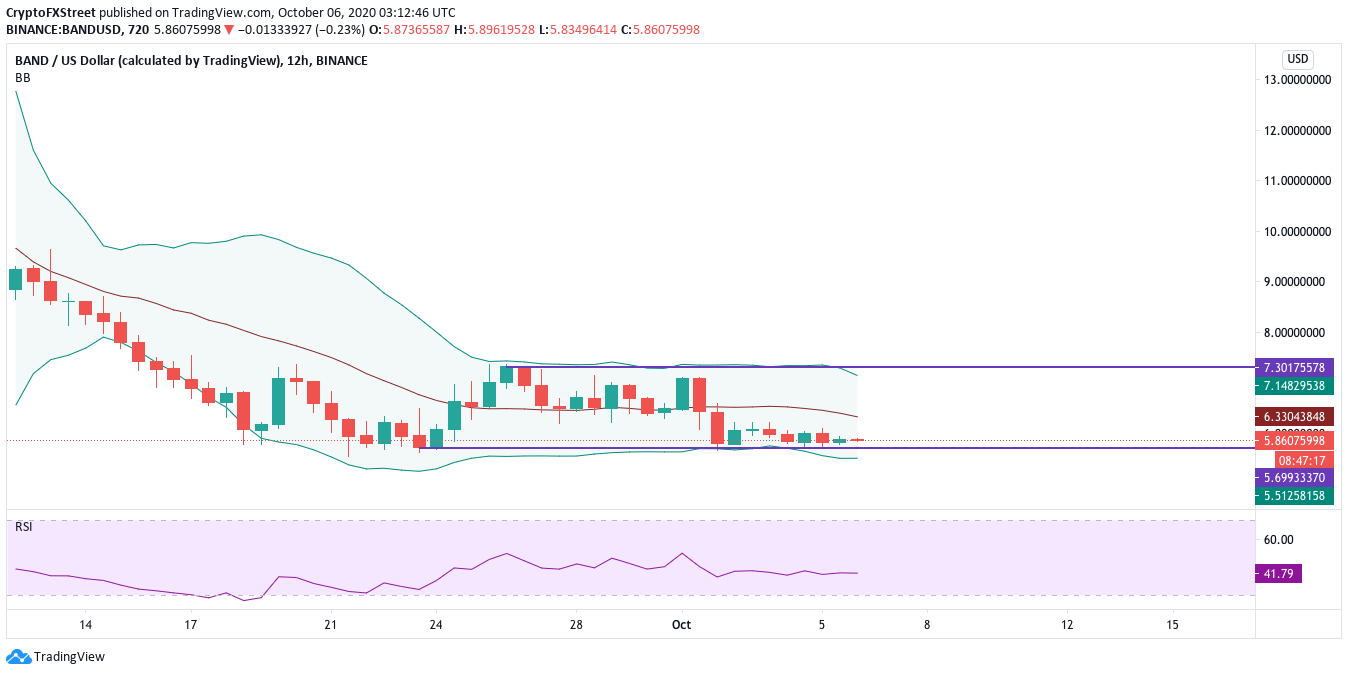
Many technical analysts view squeezes as stagnation periods that are usually succeeded by notable price movements. The longer the squeeze, the more violent the breakout that follows. This technical index's inability to provide a clear path for the direction of BAND’s trend makes the area between the lower and upper band a reasonable no-trade zone.
Currently, the price is trending in a range between $5.70 and $7.30. BAND’s fate lies in whether they breakout above or below either of these levels. To look at the realistic price targets of either of these breakouts, let’s check the daily price chart.
BAND/USD daily chart
-637375562264959700.png)
The TD sequential indicator recently presented a buy signal in the form of a red nine candlestick on BAND’s daily chart. The buyers need to consolidate this upward trend by crossing over the $6.80 resistance line and trading above the preceding green one candle. It should be noted that the last time the cross-chain data oracle platform flashed the red 9, it failed to make the most of it.
If the buyers do manage to break above the $6.80 resistance line, they should break above the Bollinger Band in the 12-hour time-frame and aim for the $9.65 resistance line, as defined by the TD sequential. The MACD shows sustained bullish momentum, so the buyers should be able to make this move.
The Flipside: What if the bears take over?
Now, what if history repeats itself and BAND doesn’t take proper advantage of the red nine signal? What if the price has a bearish breakout from the Bollinger Band in the 12-hour chart and falls below the $5.70-mark? In this case, the spike in selling pressure will force BAND down to the 200-day SMA curve ($4.072).
BAND New Addresses
There is another troubling sign that shows that the long-term outlook of BAND may be bearish.
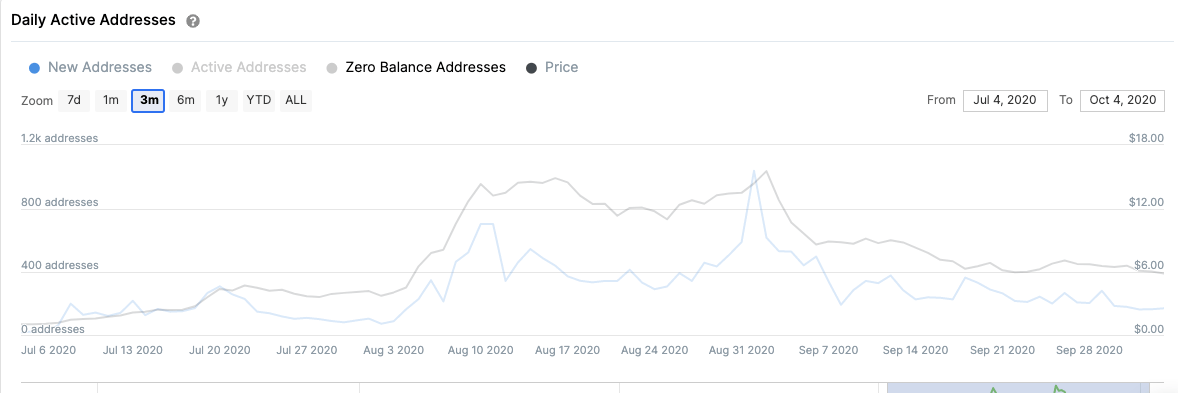
IntoTheBlock’s “Daily Active Addresses” model shows that the number of new addresses created on the Band Protocol network topped-out on September 1, 2020, at a high of 1,040 addresses per day, calculated on a 3-month trailing average. Since then, BAND’s network growth has declined by new active addresses per day.
Only 174 new addresses were created at press time based on this trailing average, which can be considered a major bearish sign for BAND.
What is Band Protocol?
Band Protocol is a cross-chain decentralized oracle that allows smart contracts to connect and aggregate any external data source or API in a trust-less and scalable manner. Blockchain oracles play a key role in syncing the blockchain world with the "outside" world. They are trusted third-part services that provide smart contracts with real-time external information.
Author

Rajarshi Mitra
Independent Analyst
Rajarshi entered the blockchain space in 2016. He is a blockchain researcher who has worked for Blockgeeks and has done research work for several ICOs. He gets regularly invited to give talks on the blockchain technology and cryptocurrencies.


