Axie Infinity slides towards $65 as AXS weakness expected to continue
- Axie Infinity price remains extremely overbought relative to its peers and the broader market.
- Downside risks, however, are limited compared to upside potential.
- AXS now positioned for strong trades on both sides of the market.

Axie Infinity price has been one of the best performers of 2021. Despite the selling pressure and the broader cryptocurrency market has experienced, AXS has maintained nearly all of its impressive gains. But a deeper pullback may yet occur.
Axie Infinity price may find sellers as capital rotates into undervalued assets
Axie Infinity price has two powerful trading opportunities on its Point and Figure chart that represent the long and short sides of the market. The first trade idea is a theoretical long entry with a buy stop order at $130, a stop loss of $115, and a profit target at $180. This trade idea represents a 3.33:1 reward for the risk.
Because the overall trend is bullish, the long entry for the Axie Infinity price idea is the most likely to play out. Also, the long entry has several bullish events if triggered. First, the entry confirms the breakout above a triple-top. Second, the entry confirms a breakout above a bull flag. And third, the entry is a breakout above the prior dominant bearish trendline and converts the Point and Figure chart into a bull market.
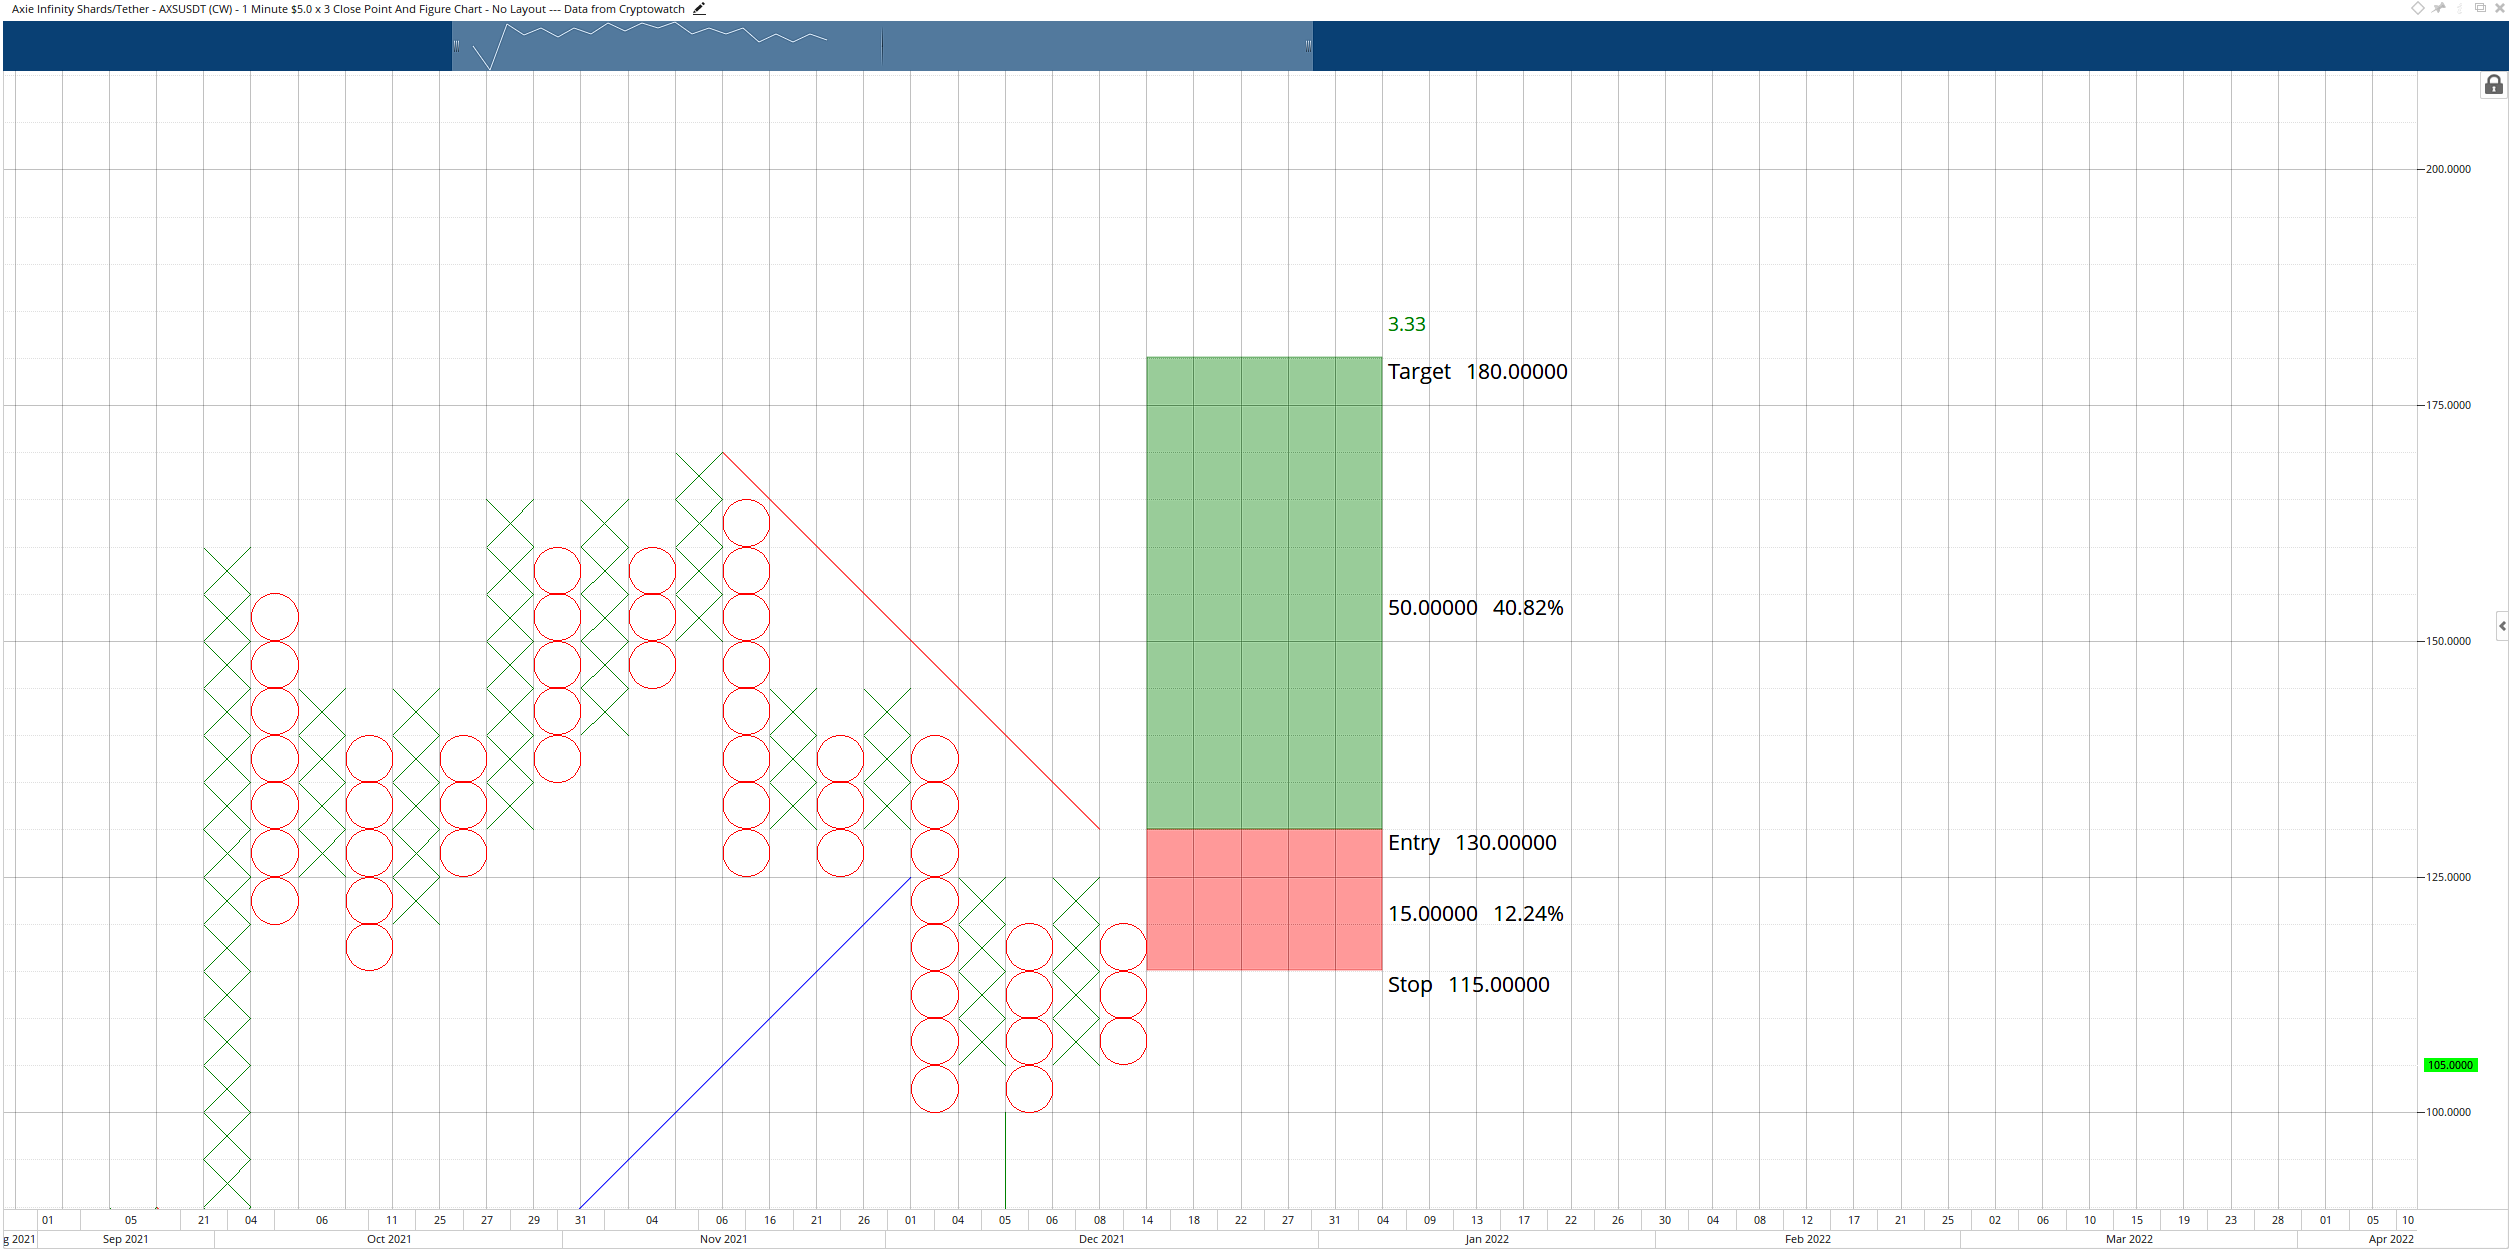
AXS/USDT $5.00/3-box Reversal Point and Figure Chart
The long entry idea is invalid if Axie Infinity price drops below $90.
The hypothetical short trade setup for Axie Infinity price is a sell stop order at $95, a stop loss at $110, and a profit target at $65. The short idea represents a 2:1 reward for the risk. The entry confirms a break below a triple bottom and the creation of new monthly lows.
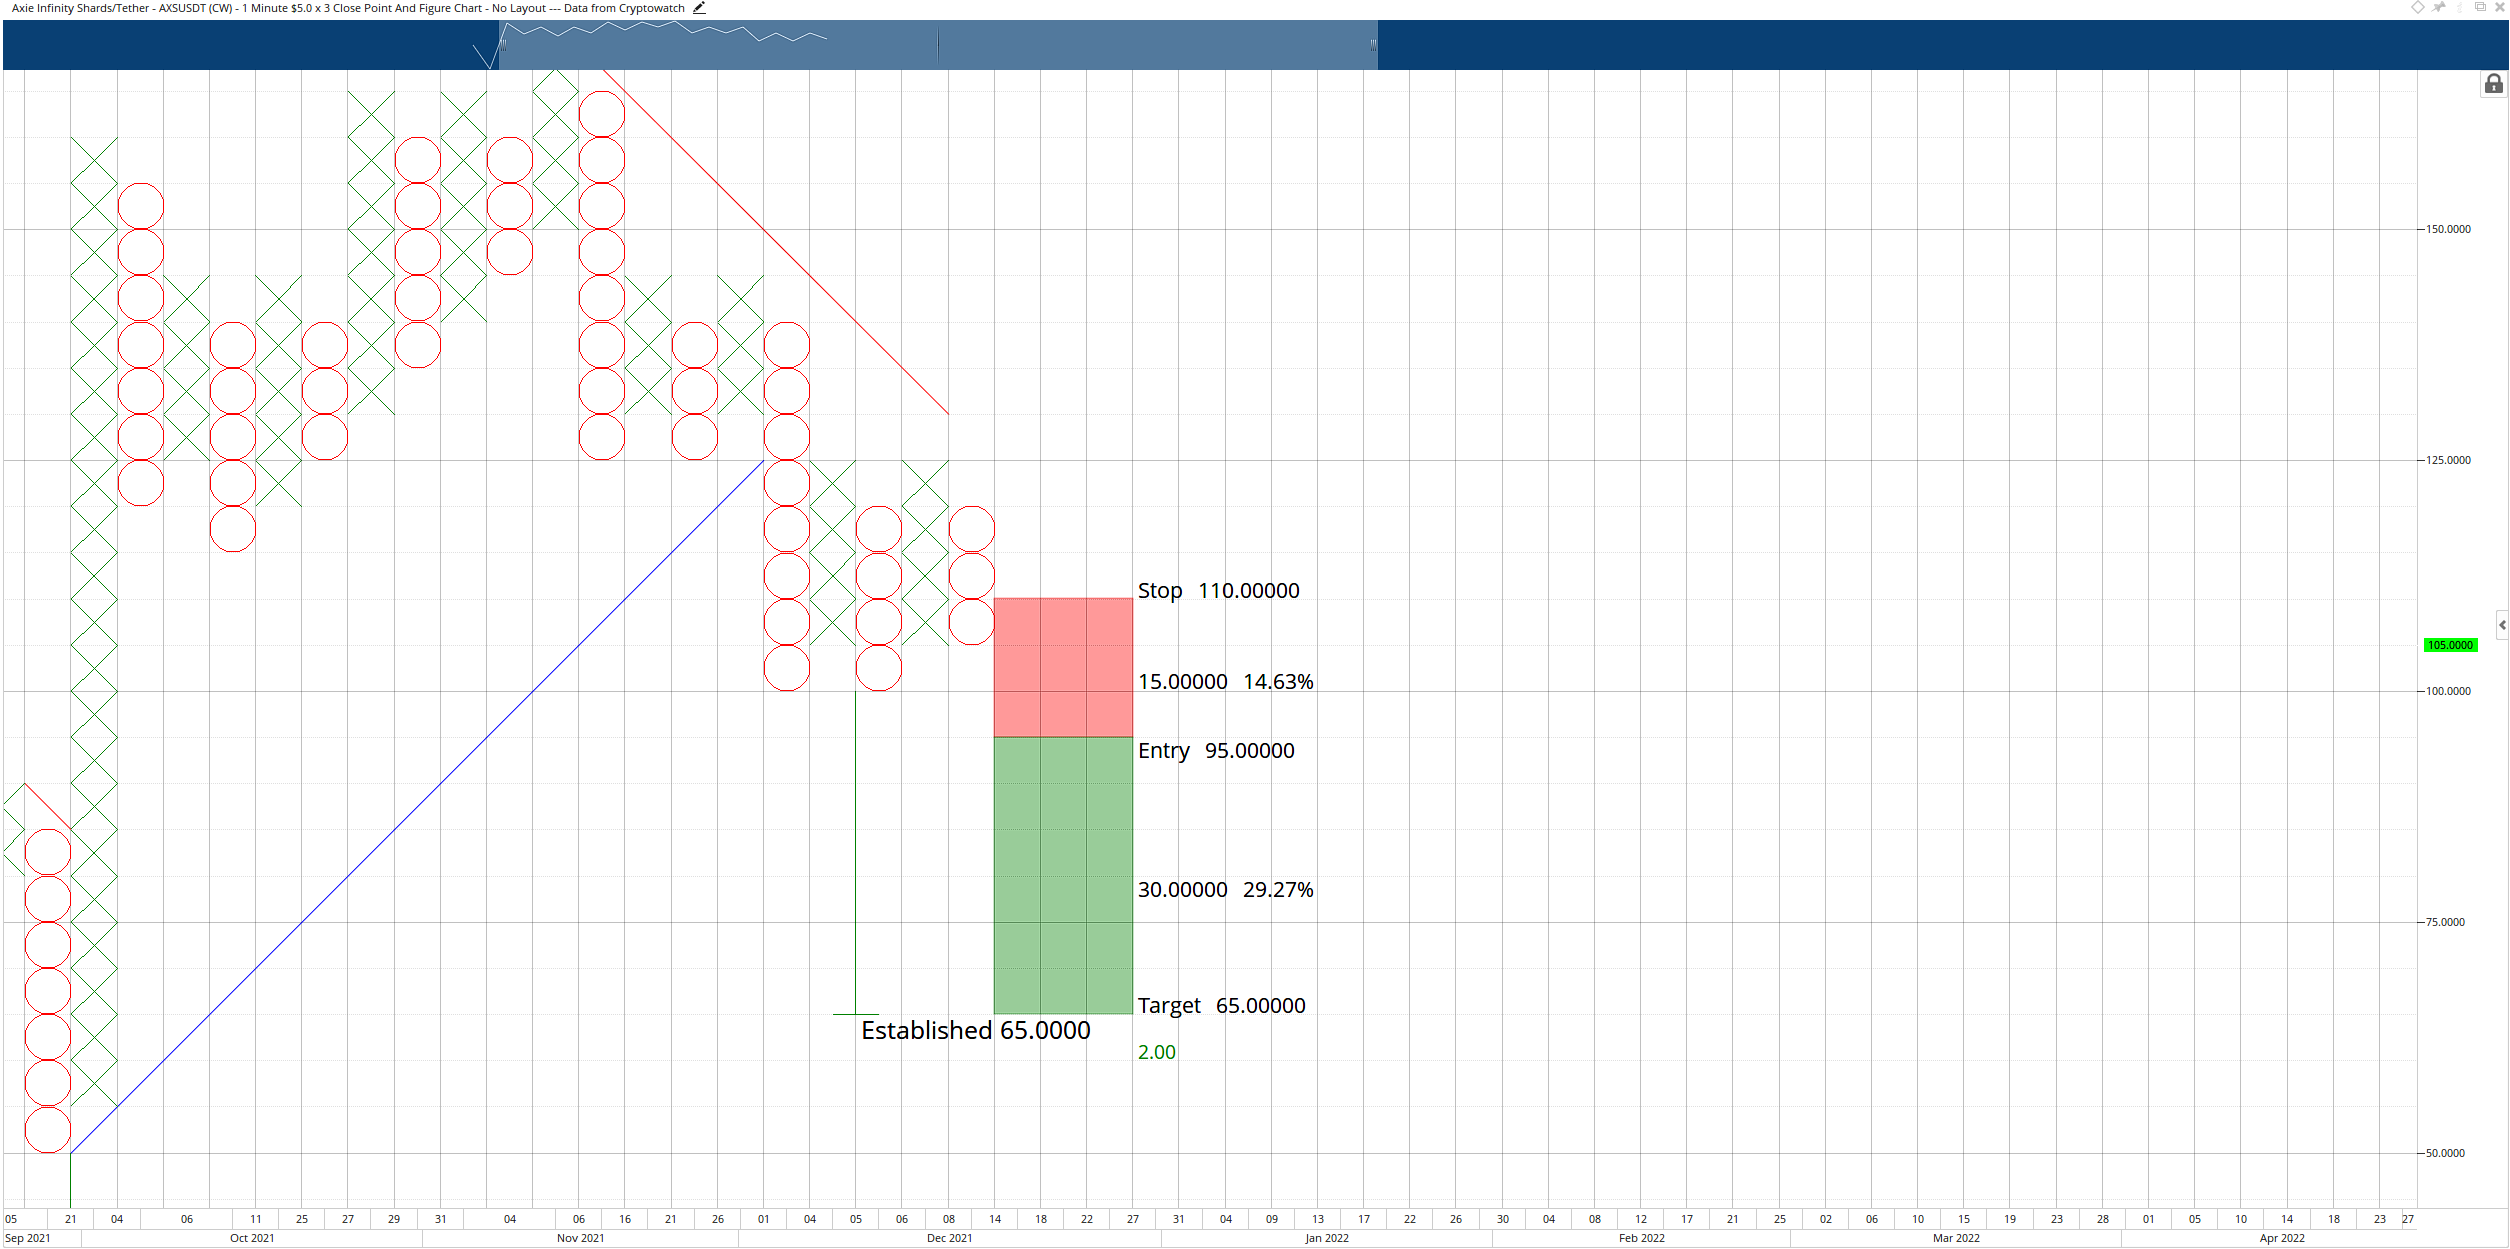
AXS/USDT $5.00/3-box Reversal Point and Figure Chart
The short trade idea is invalidated if the long entry triggers.
Author

Jonathan Morgan
Independent Analyst
Jonathan has been working as an Independent future, forex, and cryptocurrency trader and analyst for 8 years. He also has been writing for the past 5 years.



