Axie Infinity price prepares for a 27% ascent as bearish momentum weakens
- Axie Infinity price is ready to reverse the period of underperformance with a 27% upswing.
- Only a break above the upper boundary of the governing technical pattern at $95 could put the bullish target of $121 on the radar.
- However, AXS will face an abundance of resistance ahead.

Axie Infinity price appears ready for a 27% bounce toward $121 if it manages to slice above the resistance line of the governing chart pattern. However, AXS may face ample challenges ahead before the bullish target could be reached.
Axie Infinity price offers bullish outlook
Axie Infinity price has formed a falling wedge pattern on the 4-hour chart, suggesting an overall optimistic outlook. AXS must break above the upper boundary of the technical pattern at $95 in order for the 27% ascent target toward $121 given by the prevailing chart pattern to be achieved.
Additional resistance may emerge at the 21 four-hour Simple Moving Average (SMA) at $96, then at the 50 four-hour SMA at $98, coinciding with the 23.6% Fibonacci retracement level.
The following obstacle for Axie Infinity price is at the 100 four-hour SMA which intersects with the 38.2% Fibonacci retracement level at $102. Further hurdles may emerge at the 50% retracement level at $106, then at the 61.8% Fibonacci retracement level at $110, followed by the 78.6% Fibonacci retracement level at $115.
Axie Infinity price may also face headwind at the 200 four-hour SMA at $117 before the bulls reach for the bullish target and December 8 high at $121.
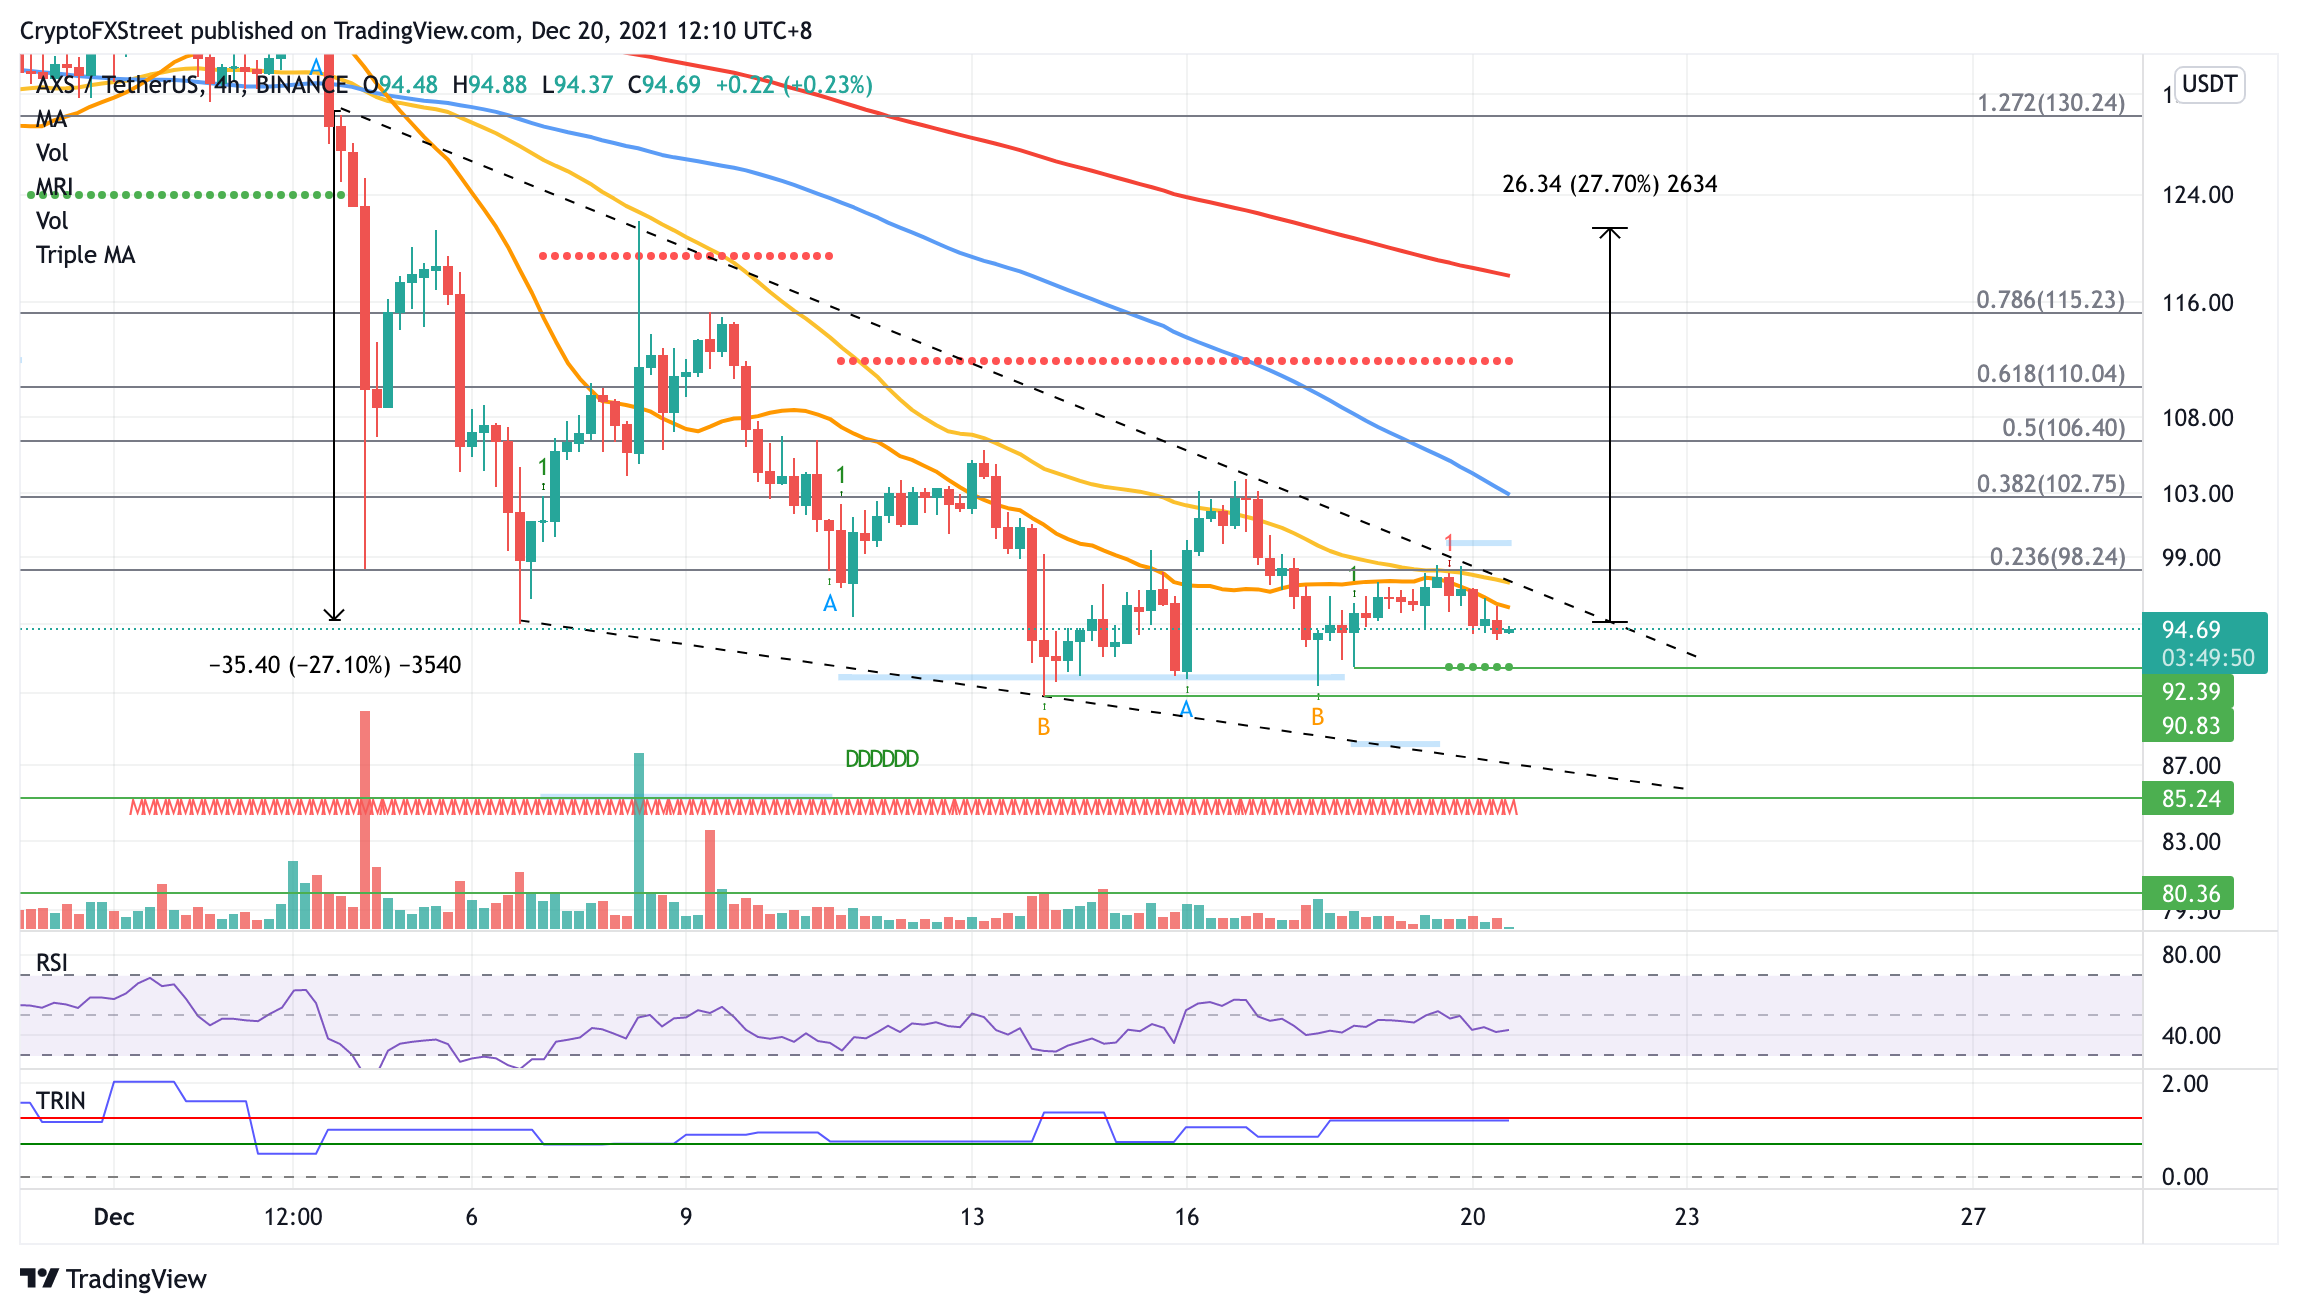
AXS/USDT 4-hour chart
However, if selling pressure increases, Axie Infinity price may fall toward the December 18 low and support line given by the Momentum Reversal Indicator (MRI) at $92.
Additional lines of defense will appear at the December 14 low at $90, then at the September 6 high at $85, coinciding with the lower boundary of the falling wedge pattern. Only if a massive spike in sell orders occurs will see AXS slide further toward the September 7 high at $80.
Author

Sarah Tran
Independent Analyst
Sarah has closely followed the growth of blockchain technology and its adoption since 2016.


