Axie Infinity Price Prediction: AXS could be staring at 38% correction
- Axie Infinity price might be preparing for a minor upswing that will evolve into a downswing.
- A failure to slice through $46.02 could trigger the 38% correction to $28.15.
- A decisive 6-hour candlestick close above $49.80 will invalidate the bearish thesis.

Axie Infinity price has witnessed exponential growth over the past month, but it has not corrected to offset the gains. Therefore, investors can expect a retest of the trading range’s midpoint.
Axie Infinity price prepares for a potential dead cat bounce
Axie Infinity price rallied roughly 285% in July, but it has witnessed minor correction in August. While its ascent was astonishing given the timing, a retracement seems logical. However, investors must note that a minor upswing that retests the $42.69 or $45.91 resistance level is likely.
A failure to slice through these barriers will confirm the inability of the buyers and signal the bears to run amok.
The first support level sellers will encounter is the $37.66 foothold. Breaching this will push AXS down to $34.88, a stable demand barrier. While shattering the $34.88 support floor will be tough, doing so will push Axie Infinity price down to the trading range’s midpoint at $28.15.
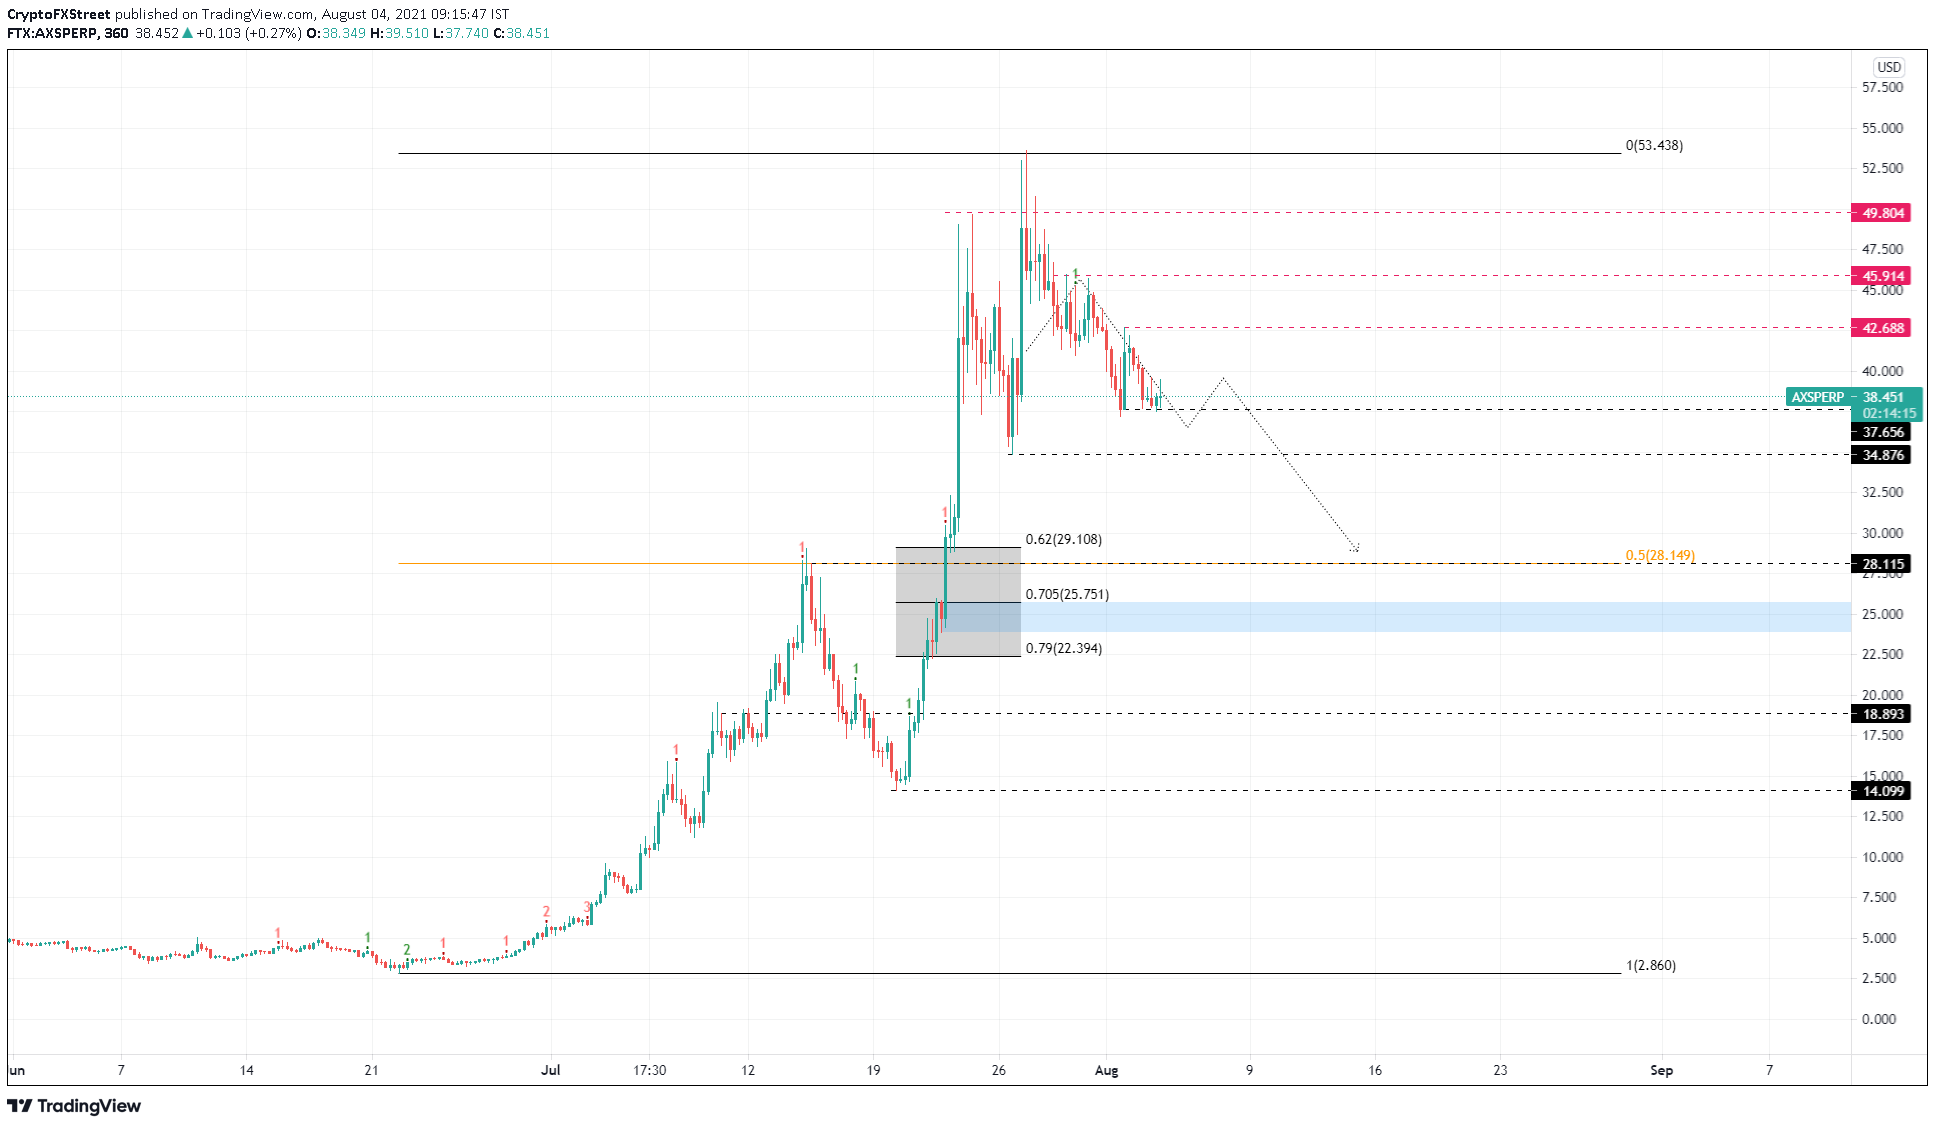
AXS/USDT 6-hour chart
While the downswing scenario seems plausible if AXS fails to breach crucial resistance levels, things will favor the bulls if the buying pressure shatters $45.91 and flips it into a support barrier.
This move will confirm that the bulls are optimistic about the performance of Axie Infinity price.
Tables will turn if AXS flips the $49.80 resistance level into a demand floor.
Such a development will invalidate the bearish thesis and open up the possibility of a retest of the all-time high at $53.59.
Author

Akash Girimath
FXStreet
Akash Girimath is a Mechanical Engineer interested in the chaos of the financial markets. Trying to make sense of this convoluted yet fascinating space, he switched his engineering job to become a crypto reporter and analyst.


