|

Axie Infinity price could bottom out at $1.00

  • AXS price is experiencing a steep decline.
  • Axie Infinity price action has Fibonacci levels coinciding with a $1.00 target.
  • Invalidation of the bearish thesis is still a breach at $44.42.

Axie Infinity price continues a sharp decline. Fibonacci and Elliot Wave Theory suggest a $1.00 bottom.

AXS price to land at $1.00 eventually

Axie Infinity price could potentially fall further before seeing a definitive market bottom. 

Axie infinity price has printed three clear impulsive waves. Elliott wave theory suggests a 50 to 61.8% retracement level usually occurs after seeing three sets of impulse waves. A Fibonacci retracement tool surrounding all-time lows and all-time highs suggests a 61.8% retracement level at the $1 price vicinity. 

Axie Infinity price could be printing the first corrective structure set to send the AXS price to $1.00. There could be countertrend rallies before the target is reached, but overall a $1.00 price level is a likely target for long-term investors who have no interest in intraday trading.
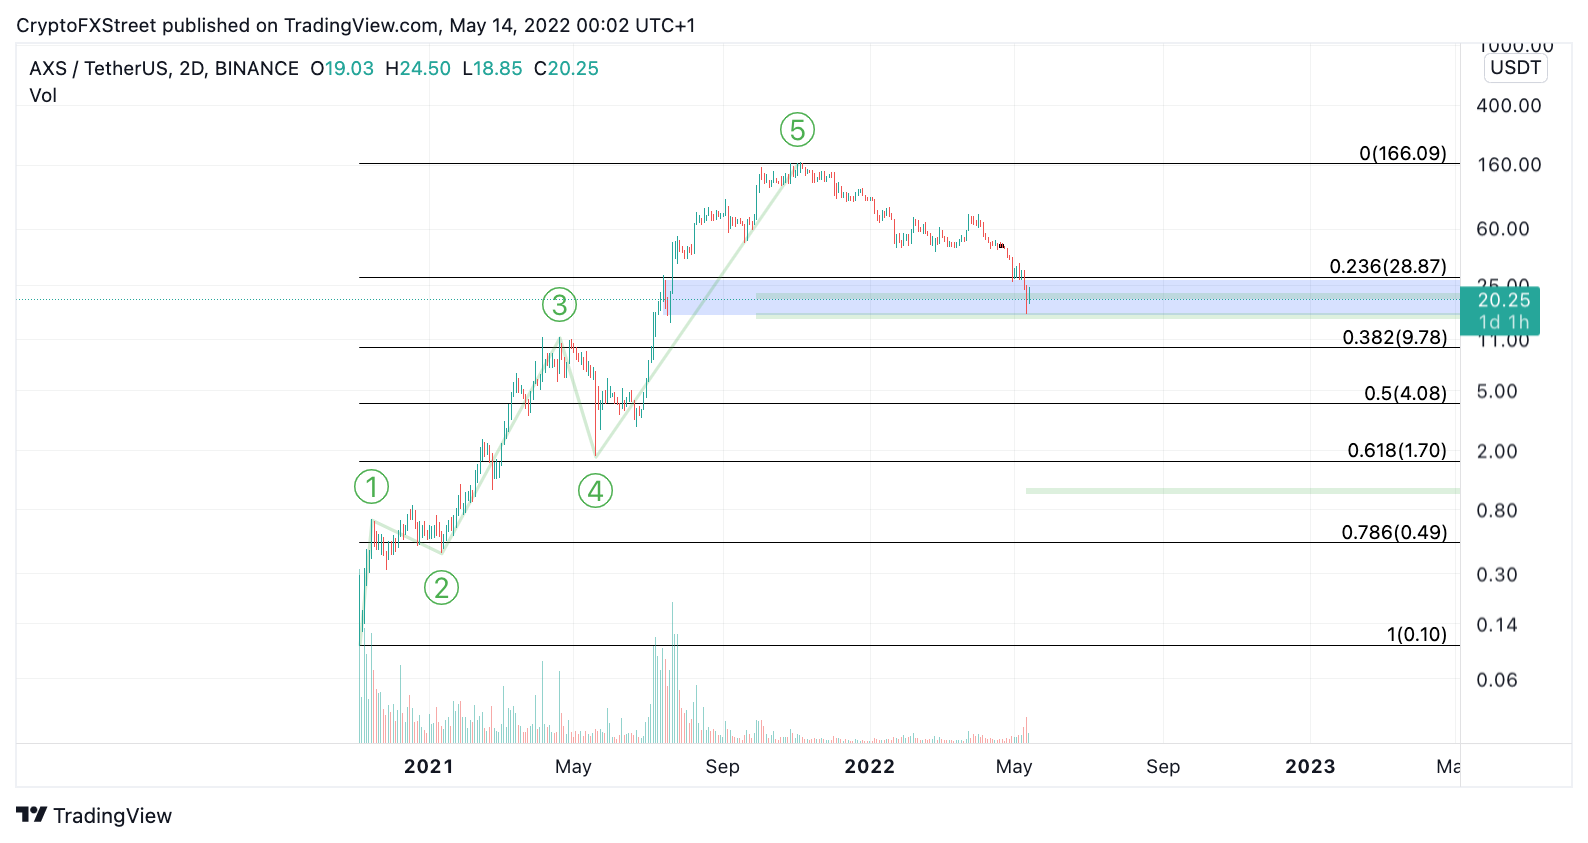
TM/AXS/5/13/22

AXS/USDT 2-Day Chart

The best confirmation for the end of the current downturn will be a breach at $44.42. If this price spike occurs, the bulls could invalidate the downward trend and send the AXS price back to $88, resulting in a 200% increase from the current AXS price. 

Author

Tony M.

Tony M.

FXStreet Contributor

Tony Montpeirous began investing in cryptocurrencies in 2017. His trading style incorporates Elliot Wave, Auction Market Theory, Fibonacci and price action as the cornerstone of his technical analysis.


More from Tony M.
Share:

Editor's Picks

Why altcoin season isn't coming back — and what stole its capital

If, after two years of being frozen in ice, Katara and Sokka woke you up to the crypto market, it would seem like 100 years have passed. With Bitcoin soaring to record highs just over a year ago, everyone expected a routine altcoin season, where investors take profits from the top crypto to chase higher returns in altcoins.

Bitcoin Weekly Forecast: BTC shrugs off CLARITY Act setback and hawkish Fed

Bitcoin recovers, trading above $78,000 on Friday, but the 50-week SMA near $78,760 continues to cap its upside. A hawkish Fed outlook, escalating Middle East tensions, and the CLARITY Act's failure to advance in the US Senate could limit BTC upside.

Why Bitcoin's over 30% rebound doesn't mean the bear market cycle is done

BTC has staged a strong recovery after falling to a yearly low of $57,800 in July, gaining nearly 33% and recording two consecutive months of gains in July and August. Is this the start of a new bullish phase, or simply another recovery within a broader bear-market cycle?

Crypto Today: Bitcoin, Ethereum, XRP eye short-term breakout as bulls return

Bitcoin trades higher near $78,000 on Friday as bulls return after early-week macro uncertainty and regulatory headwinds. Ethereum aligns with the broader crypto market’s neutral-to-bullish outlook, holding support above $2,400 and gaining momentum for a short-term breakout at $2,500.

Bitcoin: BTC shrugs off CLARITY Act setback and hawkish Fed
Bitcoin (BTC) price action has remained resilient this week, trading above $78,000 at the time of writing on Friday, heading toward a key resistance zone. Institutional demand shows early signs of weakness, with spot Exchange Traded Funds (ETFs) on track for a second straight week of outflows, with over $420 million recorded through Thursday amid escalating Middle East tensions.

