Avalanche price falls to test June lows, this is how to prepare for the possible rebound
- Avalanche is in danger of spiraling to June lows at $13.75 if support at $17.50 crumbles.
- An incoming buy signal from the TD Sequential indicator shows AVAX nearing a bullish trend reversal.
- AVAX’s technical dynamics may flip strongly bullish if the RSI breaks above a crucial descending trendline.

Avalanche price is yet to find relief following its rejection at around $30.00. Declines continue to take shape within a descending parallel channel, but AVAX’s demand area at $18.00 might be its last line of defense. Therefore, bulls must defend it as if their lives depend on it or risk Avalanche price revisiting June lows around $13.75.
How to sift through the technical noise to spot an Avalanche price recovery
Avalanche price is approaching a critical make-or-break juncture. Its immediate support at $18.00 may determine the next direction AVAX takes. Losses will likely stretch to test June lows at $13.75. However, buyers have an opportunity to seize the downtrend at $18.00 and propel the smart contracts token above $20.00.
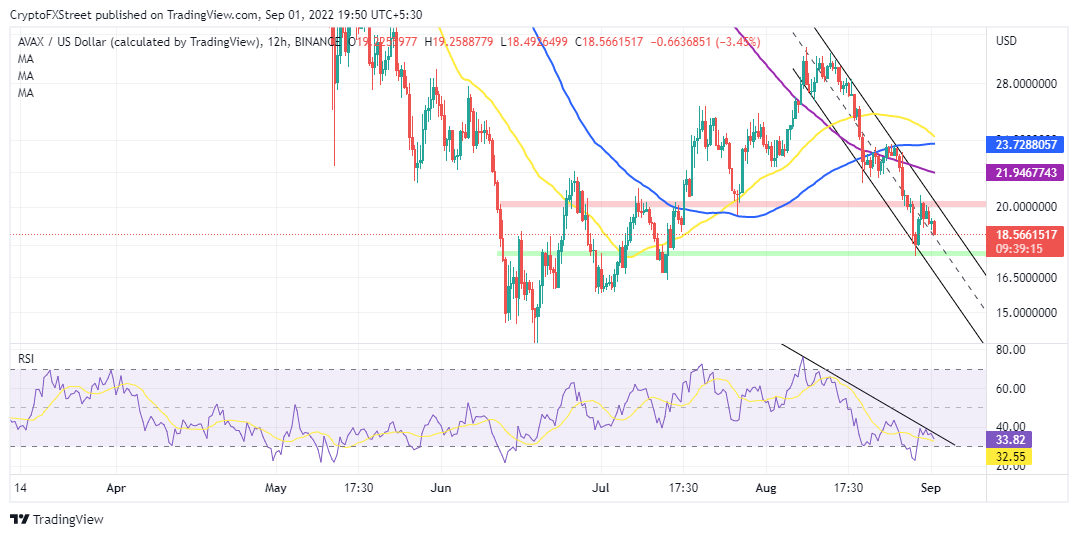
AVAX/USD 12-hour chart
There’s a possibility that investors will, from now on, take a hands-off approach on Avalanche price, citing a recent bull trap as AVAX attempted to crack through the $20.00 supply area. At the time, the Relative Strength Index (RSI) paints a grim technical picture, implying that this downtrend is far from over.
Although Avalanche price looks untradeable at the moment, especially for bullish traders, it is essential to appreciate its proximity to oversold conditions. This infers that a trend reversal could be in the offing.
An imminent RSI break above the descending trendline, as shown, could incentivize the bulls currently watching from the sidelines to get on board ahead of a potentially massive upswing not above $20.00 but robust enough to close the gap to $30.00.
Avalanche price may send a buy signal in the next few days courtesy of the TD Sequential indicator on the daily chart. Traders need to confirm the presence of a red nine candlestick before making new entries.
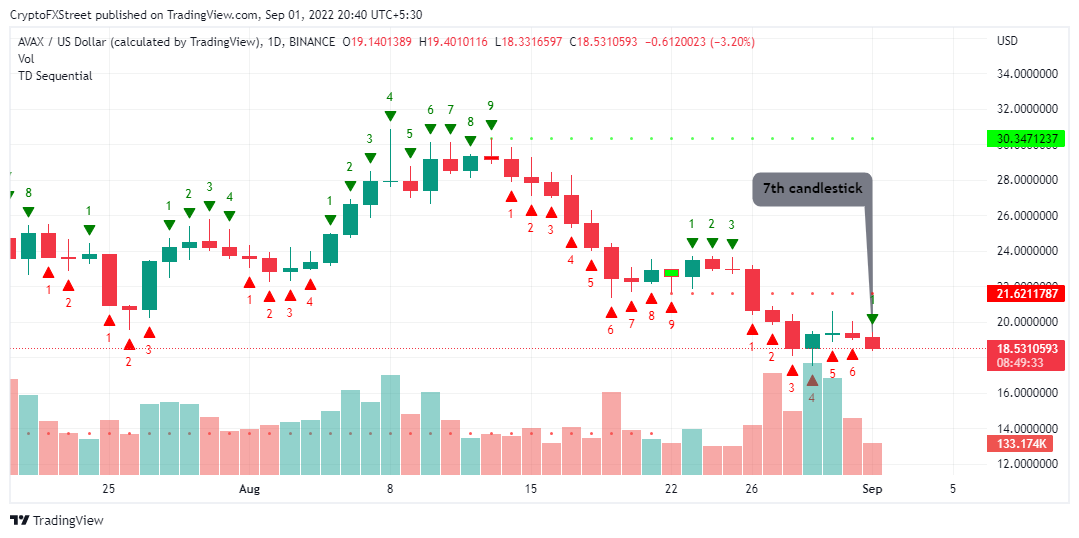
AVAX/USD daily chart
Nonetheless, a buy order is advised only when the low of the sixth and seventh bars in the count is exceeded by that of the eighth and ninth candles. This technical parameter suggests that sellers are gradually losing their grip on the price – paving the way for buyers to grab the bull by the horns for gains – potentially to $30.00.
Author

John Isige
FXStreet
John Isige is a seasoned cryptocurrency journalist and markets analyst committed to delivering high-quality, actionable insights tailored to traders, investors, and crypto enthusiasts. He enjoys deep dives into emerging Web3 tren


