ApeCoin Price Prediction: Is this the end of the road for APE bulls?
- ApeCoin price rebounds off support at $4.10 but runs out of steam below the 50-day SMA on the eight-hour chart.
- APE price flashes another sell signal amid dismal network activity.
- As exhibited by the MACD, a minor positive outlook could invalidate the continuation of the bear trend.

ApeCoin price is fighting for a breakout after a short bullish stint from its primary support at $4.10. According to short-term price analysis, APE faces mixed signals from technical and fundamental perspectives. Now, eyes are glued to the token’s ability to rise above acute seller congestion at $4.64.
Whales snuff out ApeCoin price bullish spark
As discussed, the TD Sequential indicator sent a buy signal on Friday, October 22, calling retail investors from the sidelines. However, whales remained stubbornly bearish, which curtailed the expected northbound move to $6.00 or even $6.50.
Insight from on-chain data provided by Santiment shows a continued drop in the number of addresses holding between 10,000 and 100,000 APE tokens. Only 1,367 addresses are still in this cohort compared to 2,359, as recorded on April 25.
 [16.40.41, 24 Oct, 2022]-638022163332205501.png)
ApeCoin Supply Distribution
ApeCoin price generally follows the actions of the whales, as observed from the above chart. Until whales stop this selling spree, therefore, movement to the upside could be capped by the 50-day SMA (Simple Moving Average), red.
The IOMAP on-chain model by IntoTheBlock paints a grim picture ahead for ApeCoin price. The red circles in the chart below represent holders who bought APE tokens in the respective price ranges.
If bulls manage to clear resistance at the 50 SMA, the 2,450 addresses which purchased $31.64 million APE tokens between $5.15 and $5.29 may consider selling to break even – a situation that could stifle growth and increase the risk of further declines.
-638022163764212069.png)
ApeCoin IOMAP chart
What’s next for ApeCoin price?
While a TD Sequential indicator’s buy signal triggered the move from $4.10 to $4.64, a sell signal from the same indicator screams doom for ApeCoin price. This call to offload APE manifested in a green nine candlestick, compelling sellers to take control again.
Apart from the seller congestion at the 50 SMA, sell orders are recommended if the high of candles six and seven in the count are exceeded by the high of bars eight or nine.
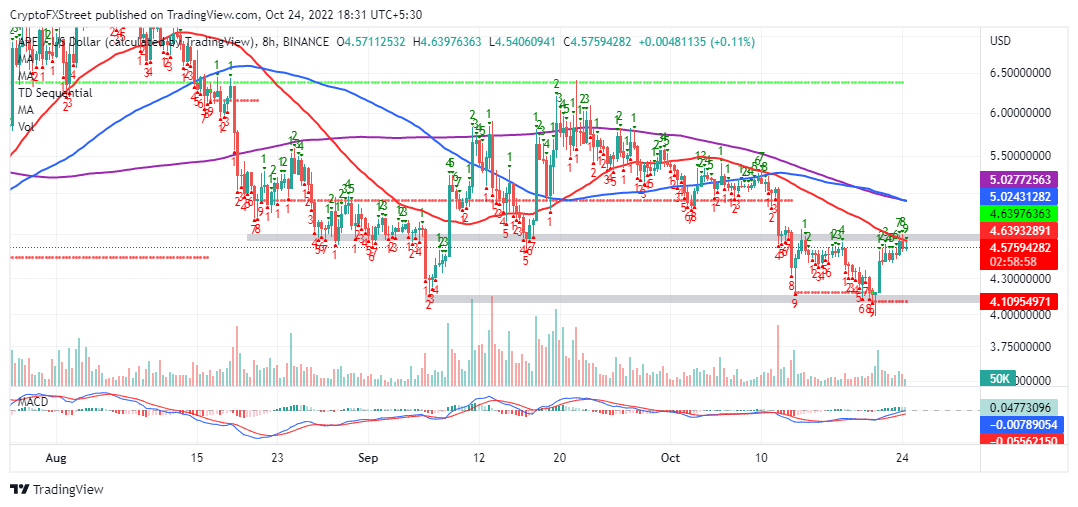
APE/USD eight-hour chart
On the bright side, the MACD (Moving Average Convergence Divergence (MACD) indicator exhibits an optimistic outlook as it lifts to the mean line. Traders looking for long positions should wait until the MACD crosses above the mean line (0.00) before activating their buy orders.
Moreover, the 12-day EMA (Exponential Moving Average) must sustain a gap above the 26-day EMA to cement the bulls’ influence on the ApeCoin price.
Author

John Isige
FXStreet
John Isige is a seasoned cryptocurrency journalist and markets analyst committed to delivering high-quality, actionable insights tailored to traders, investors, and crypto enthusiasts. He enjoys deep dives into emerging Web3 tren


