Analysts say Ethereum price must hold this key level to avoid a capitulation-like move

Traders identify key support and resistance levels that Ethereum must hold as ETH price trades at levels not seen since July 2021.
The crypto market experienced another day of pain on May 12 as the fallout from the Terra's LUNA and UST failure continues to ripple across the ecosystem.
While the coverage for UST and its impact on Bitcoin (BTC) have been extensively covered over the past few days, the pullback has also had a significant impact on the price of Ether (ETH) as traders hastily exited the market.
Data from Cointelegraph Markets Pro and TradingView shows that the past seven days of selling dropped Ether to $1,701, a price not seen since July 2021.
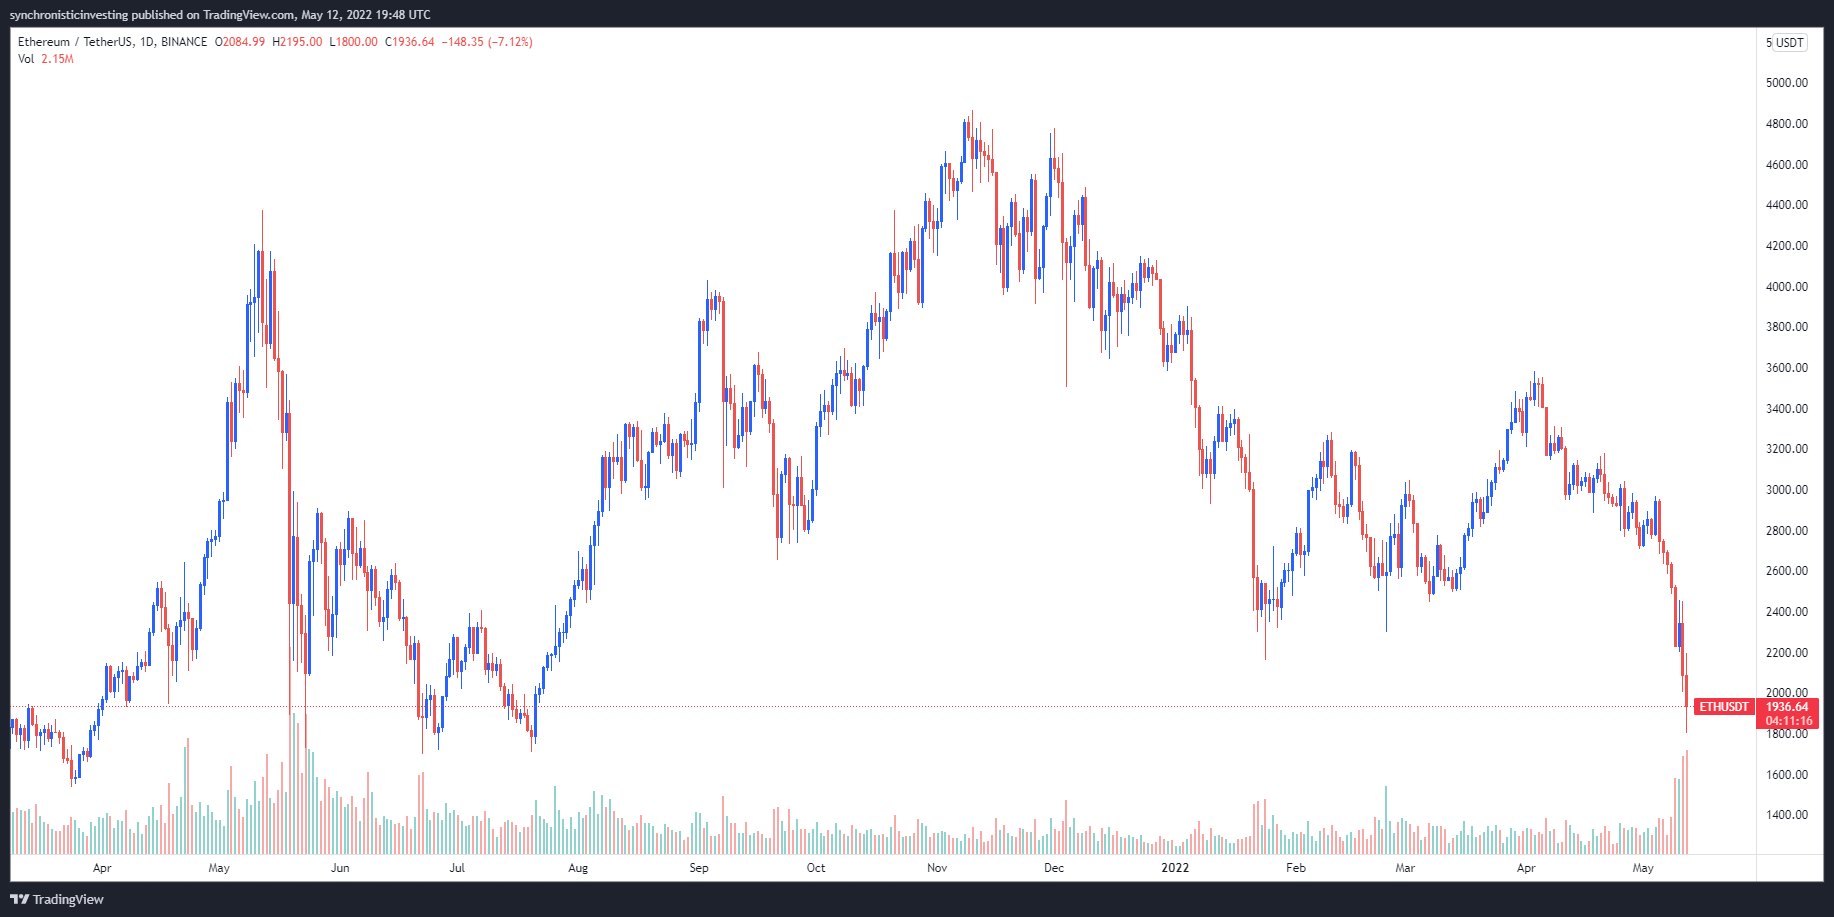
ETH/USDT 1-day chart. Source: TradingView
Here’s a look at what several analysts are saying about the outlook for Ethereum and what support and resistance levels to keep an eye on.
Ether needs to reclaim $2,250
The overnight plunge to the low $1,700 range was documented by crypto analyst and pseudonymous Twitter user ‘Rekt Capital’, who posted the following chart outlining the major support and resistance zones for Ether.
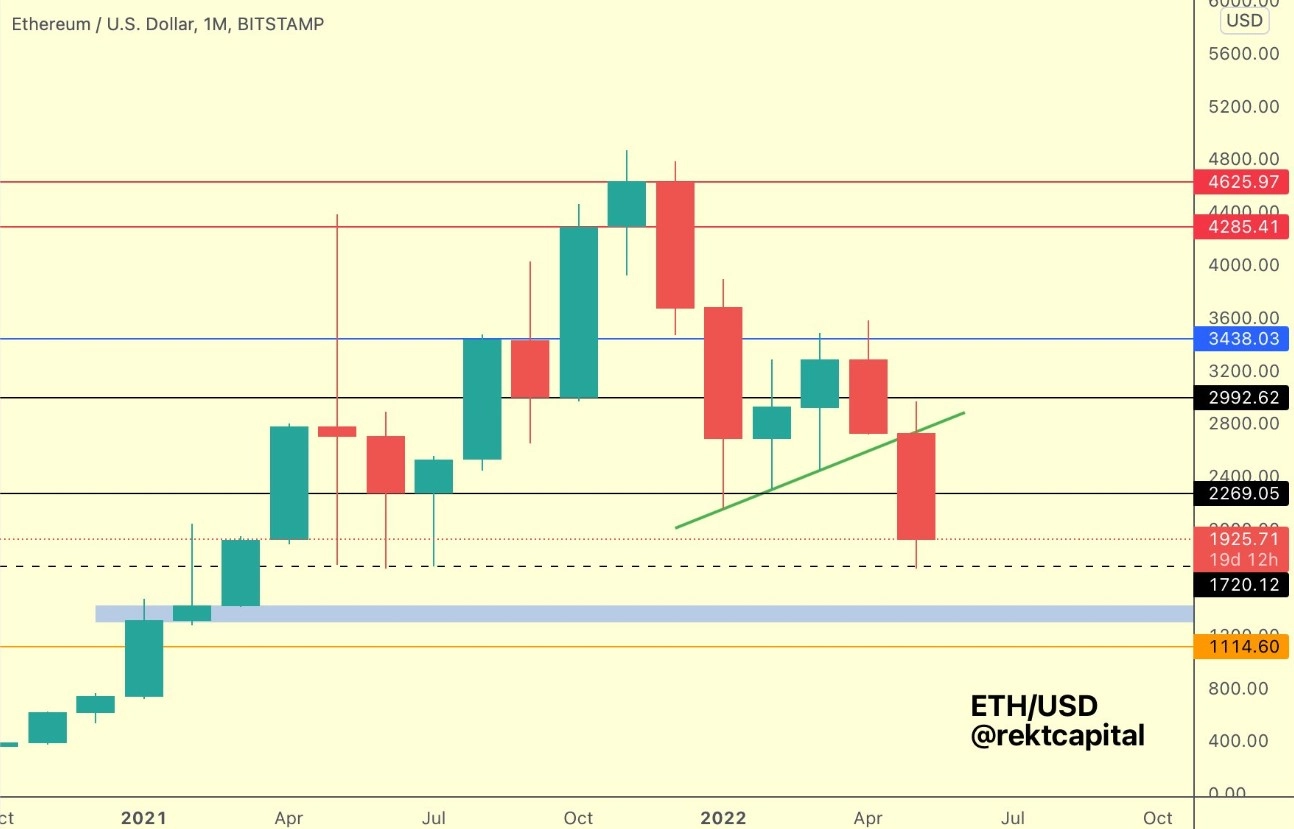
ETH/USD 1-month chart. Source: TradingView
Rekt Capital said:
If Ether isn't able to rebound strongly from here so as to Monthly Close above the black ~$2,250 level above, the ~$1,720 will reveal weakness and may not hold price.
Should a further breakdown in price occur, Rekt Capital indicated that the blue zone on the chart is the “ next major support sub ~$1720,” which is located near $1,350.
Bouncing off the 2021 summer lows
Insight into what Ether's price action may look like should it head lower was provided in the following tweet by ‘Crypto Feras’, who mused that just a few weeks ago it sounded crazy to talk about Ether falling to these levels.
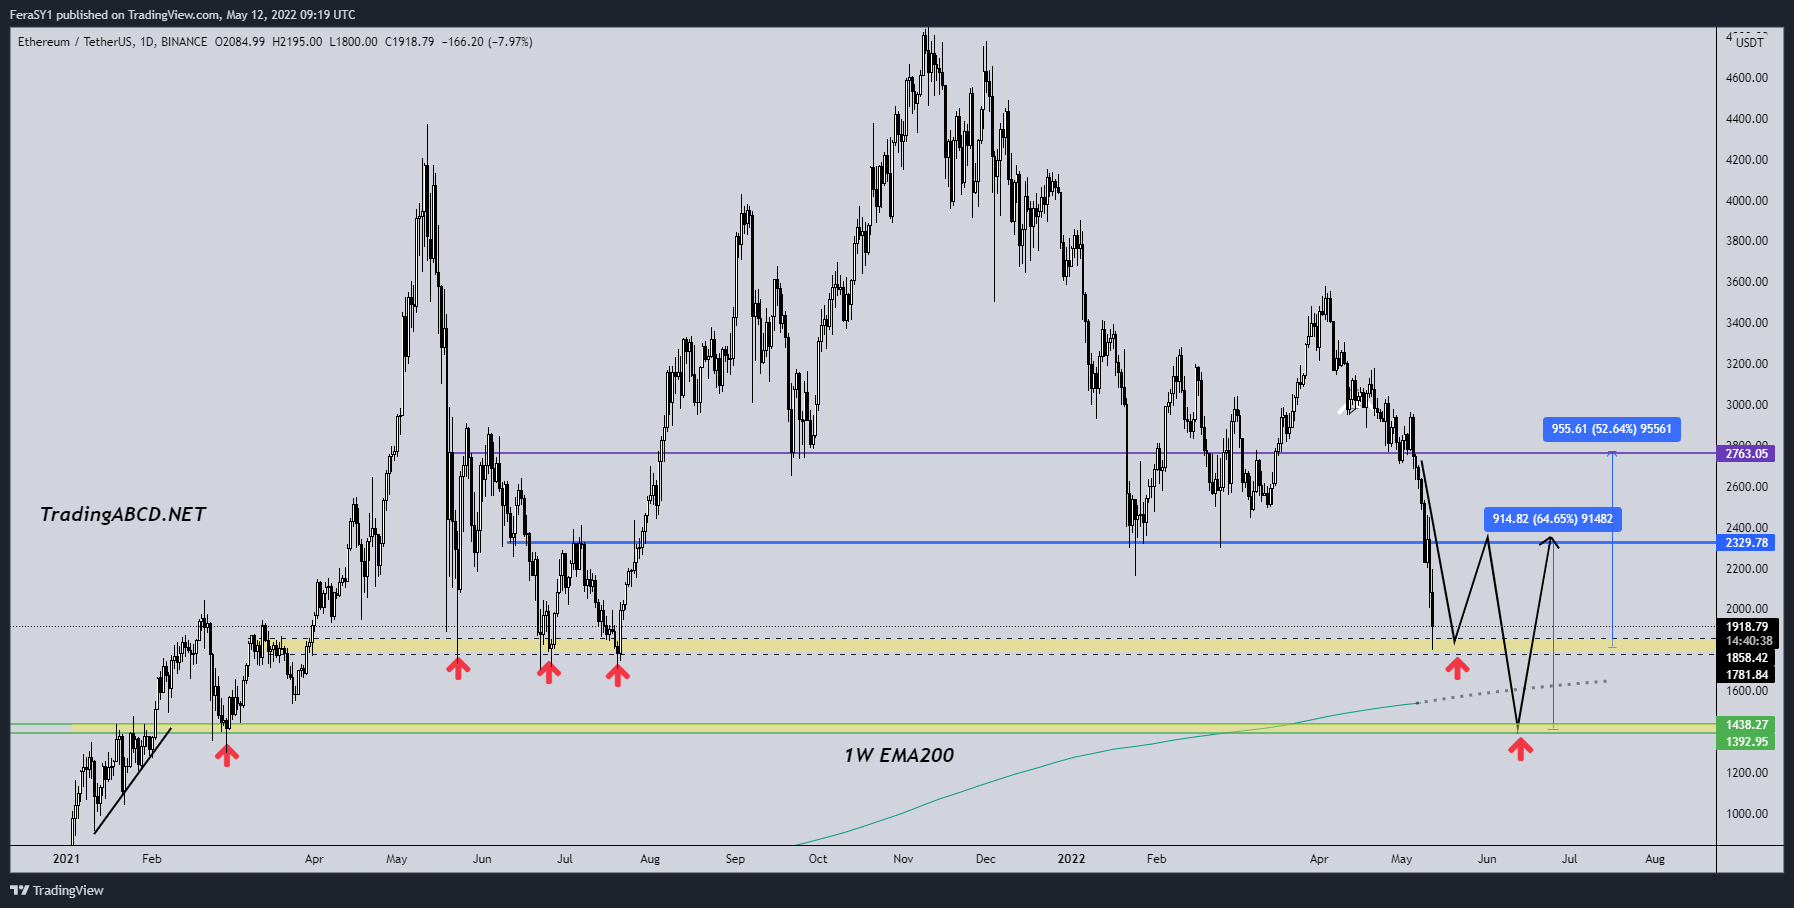
ETH/USDT 1-day chart. Source: TradingView
Crypto Feras said:
Technically Ether is bouncing off its 2021 summer lows (outperforming Bitcoin so far). The bounce areas are either this $1,700 - $1,800 [range] or we [are] gonna have to test [the] $1,400 zone.
Possible short-term retest of $1,550
A longer-term view of the Ether's price action was discussed by market analyst Caleb Franzen, who suggested that a “bearish” breakdown below a major trendline.
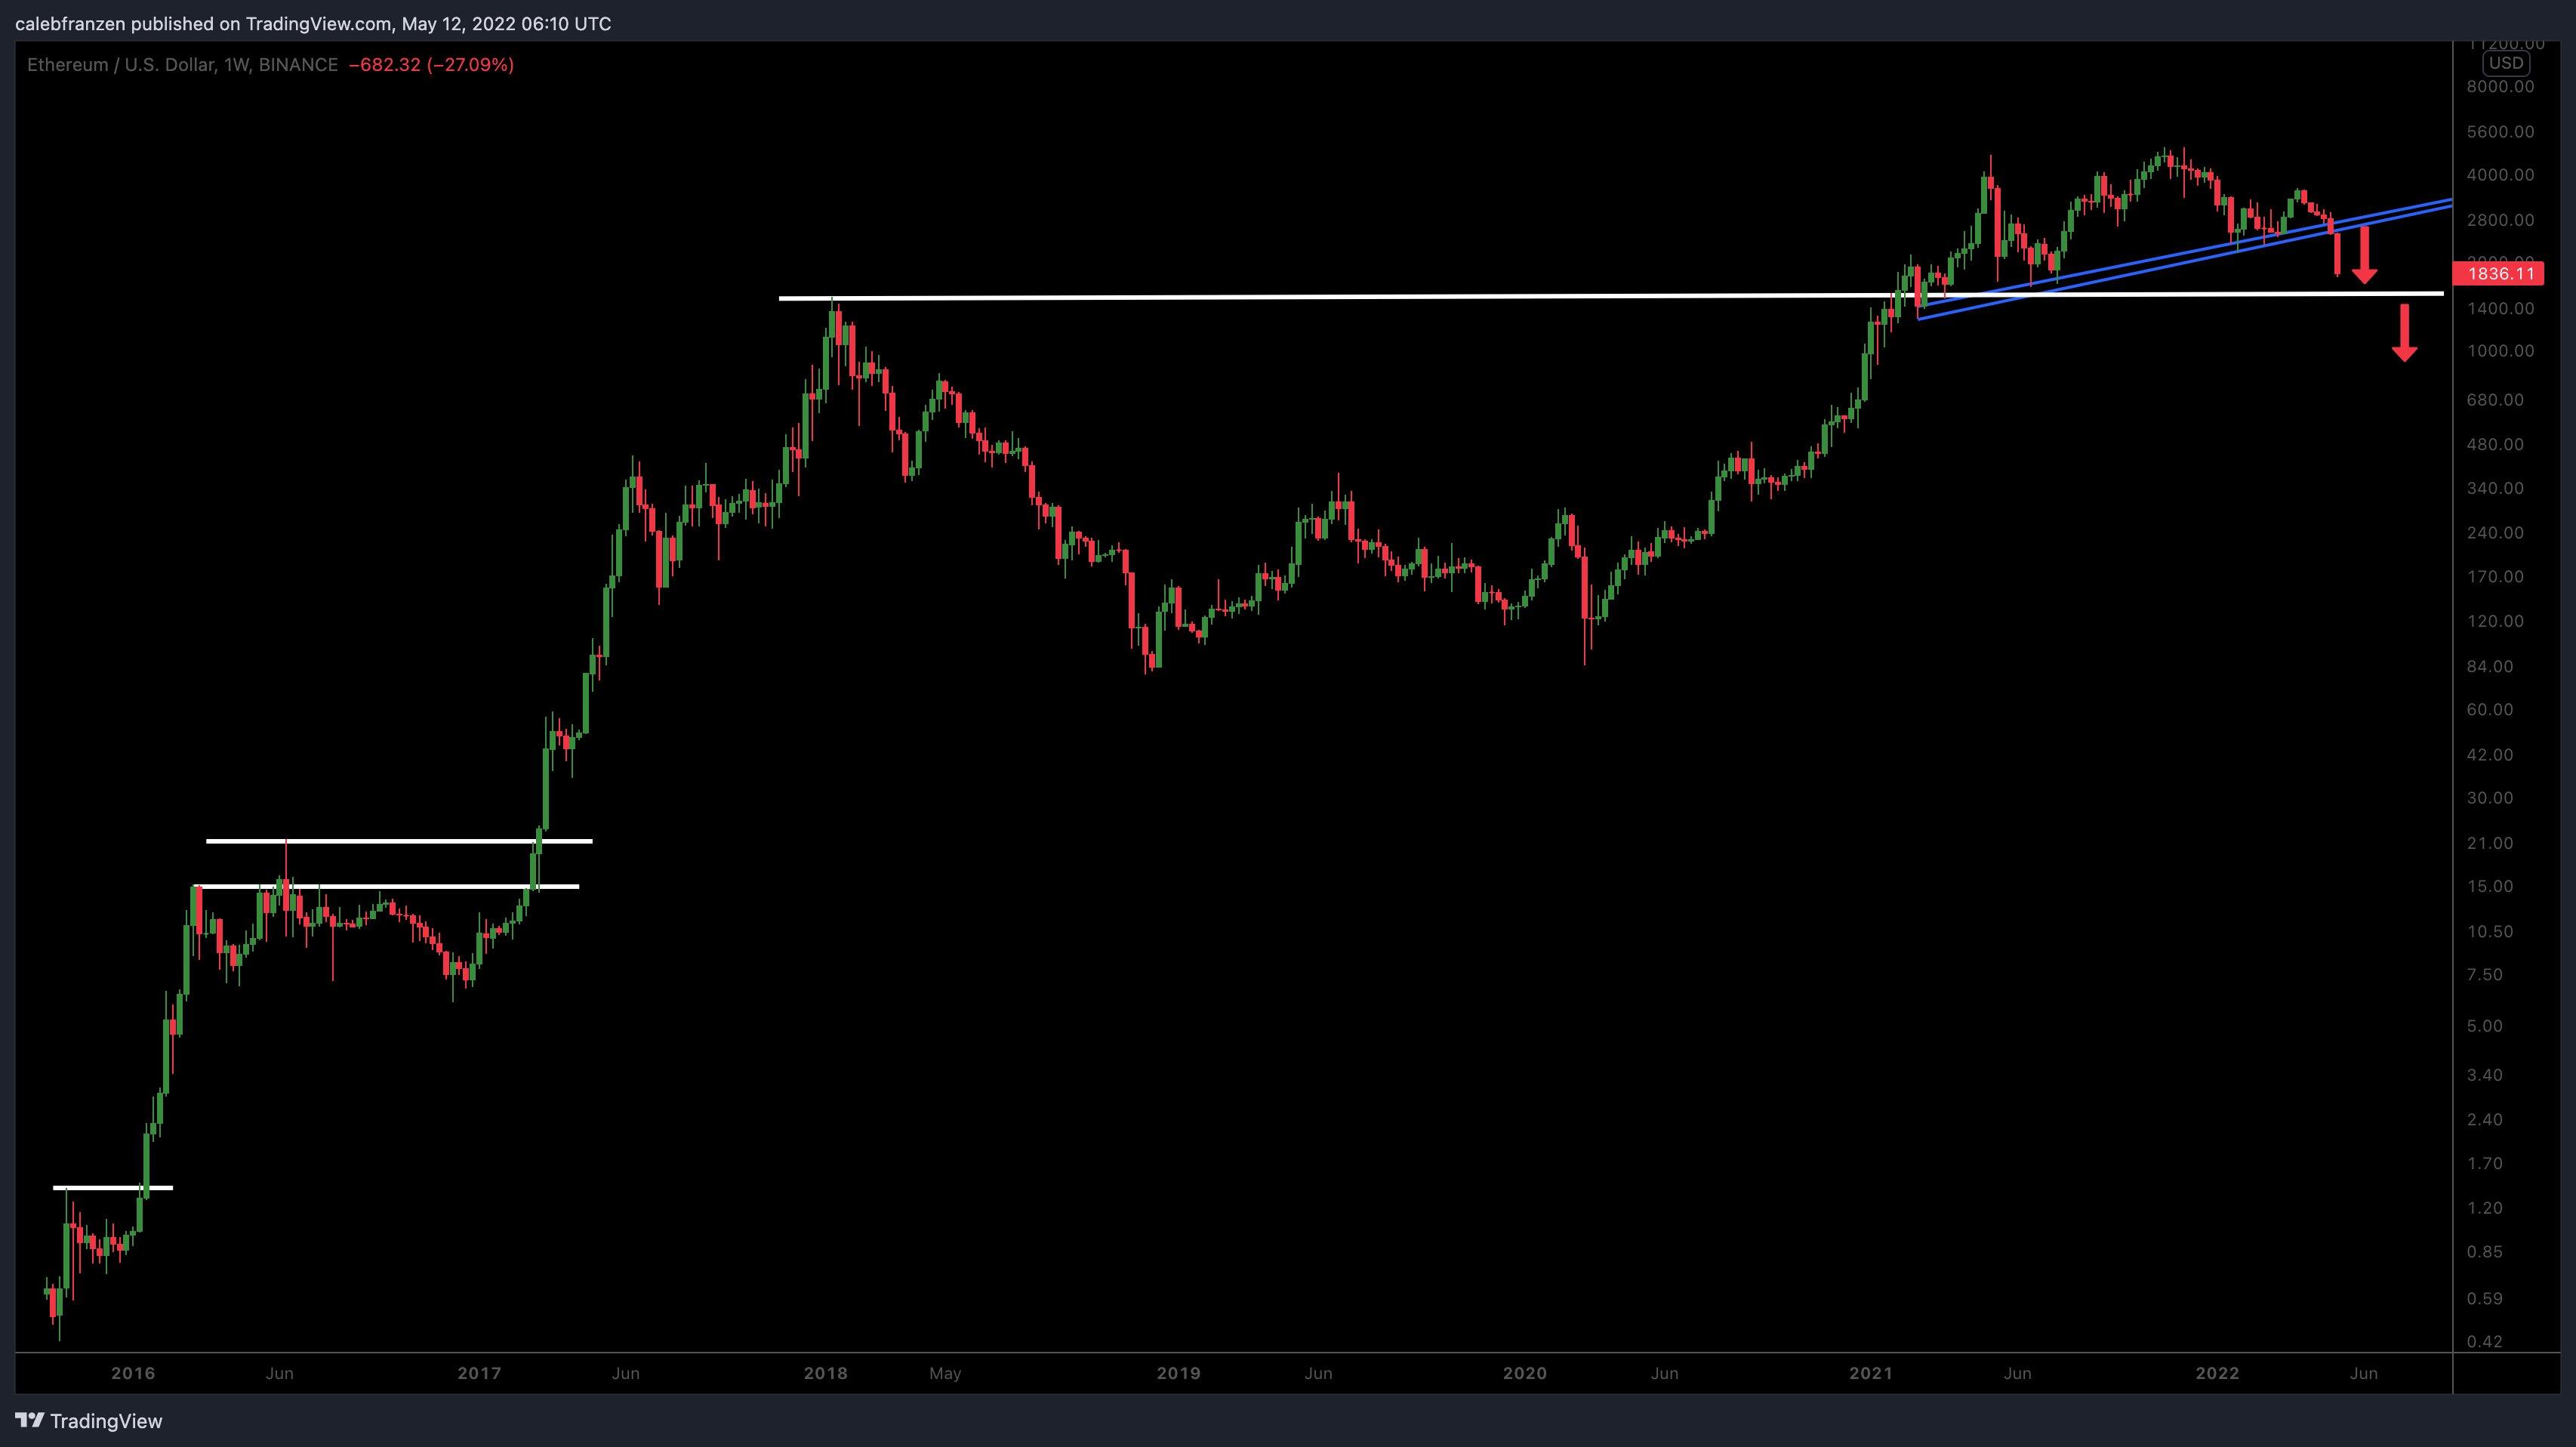
ETH/USDT 1-week chart. Source: Twitter
Franzen said:
Very possible that we retest the January 2018 highs, around $1,550, in the next 24 hours. If/when we break below that former resistance level, that's another bearish signal.
The overall cryptocurrency market cap now stands at $1.219 trillion and Ether’s dominance rate is 19.2%.
Author

Cointelegraph Team
Cointelegraph
We are privileged enough to work with the best and brightest in Bitcoin.




