Altcoins to watch this week: ALGO and BCH show potential for double-digit rally
- Algorand and Bitcoin Cash prices stabilized around key levels on Tuesday, following a rally of over 4% the previous day.
- On-chain data shows a positive bias, as ALGO’s bullish bets are increasing, while BCH's daily active addresses reach a new all-time high.
- The technical outlook suggests a rally ahead, targeting double-digit gains.

Algorand (ALGO) and Bitcoin Cash (BCH) prices stabilize around $0.22 and $368, respectively, at the time of writing on Tuesday, following a rally of over 4% the previous day. On-chain data show a positive bias, as ALGO’s bullish bets are increasing, while BCH's daily active addresses reach a new all-time high. The technical outlook for both altcoins suggests a rally ahead, targeting double-digit gains.
Algorand Price Forecast: ALGO could rise further above falling wedge pattern
Algorand price broke above the falling wedge pattern (drawn by connecting multiple highs and lows with two trendlines since early December) on Monday. The breakout of this pattern generally favors the bulls. At the time of writing on Tuesday, it hovers around the $0.22 level.
If ALGO finds support around the daily level of $0.21 and continues its upward momentum, it could extend the rally by 22% from its current level to retest its next weekly resistance at $0.27.
The Relative Strength Index (RSI) on the daily chart reads 64, above its neutral level of 50, indicating bullish momentum. Moreover, the Moving Average Convergence Divergence (MACD) indicator also displayed a bullish crossover, providing buy signals and indicating a potential continuation of the upward trend.
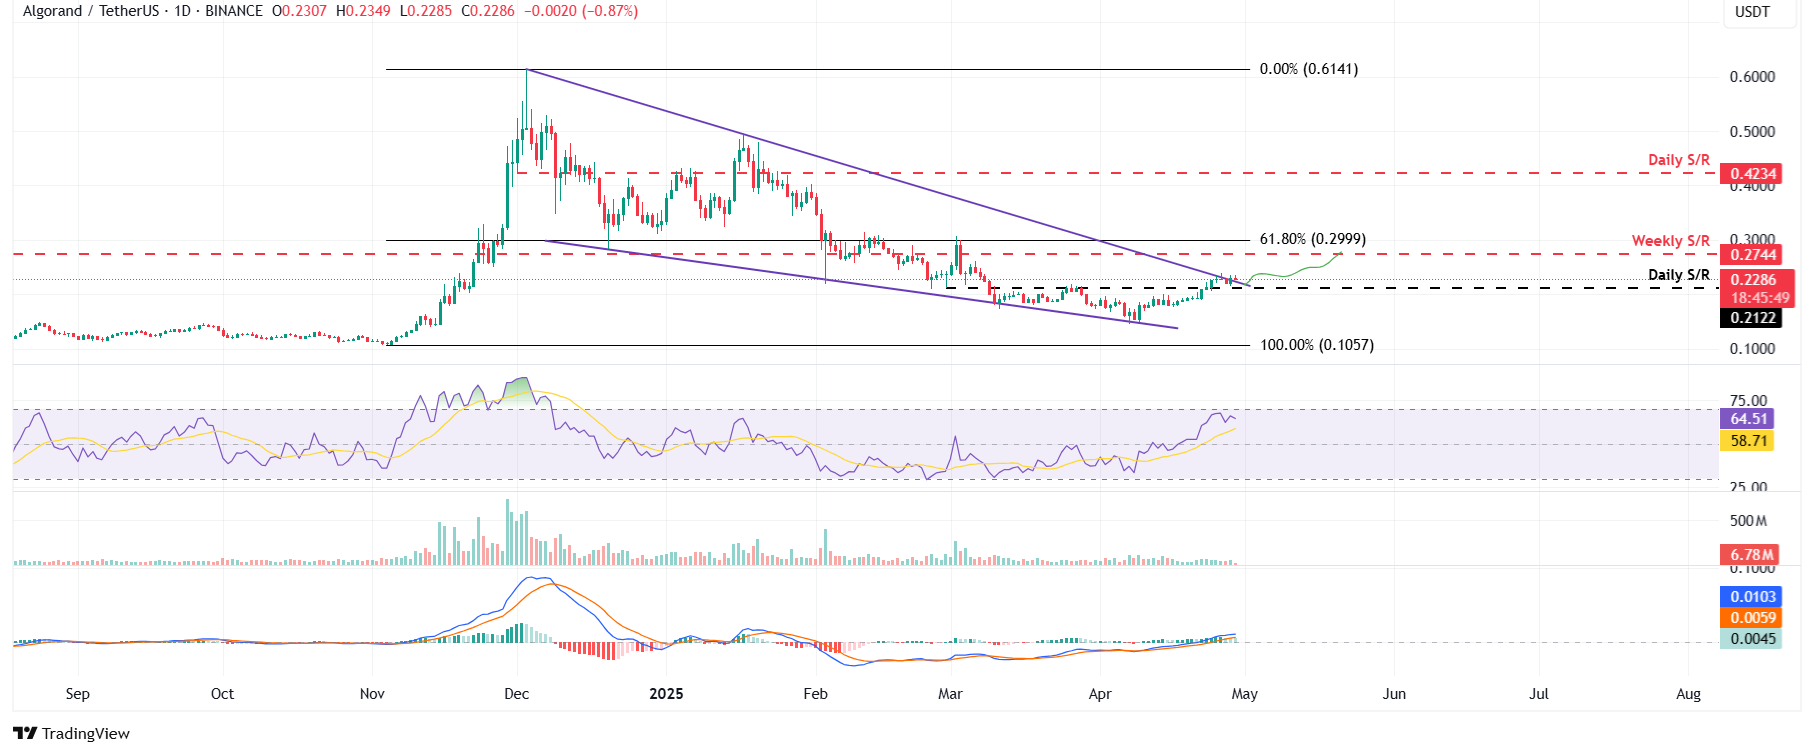
ALGO/USDT daily chart
Another bullish sign is Coinglass’s ALGO long-to-short ratio, which reads 1.07, the highest level in over a month. This ratio, above one, reflects bullish sentiment in the markets, as more traders are betting on the asset price to rise.
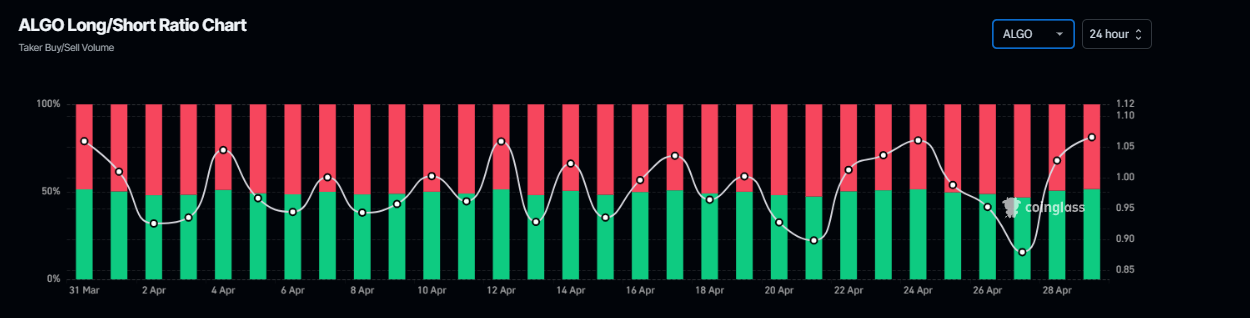
ALGO long-to-short ratio chart. Source: Coinglass
Bitcoin Cash Price Forecast: BCH could extend 17% rally if it closes above $390
Bitcoin Cash price broke and then retested the descending trendline on April 16, rallying 15.41% in the next eight days. It rose 5.38% on Monday after a slight decline during the weekend. At the time of writing on Tuesday, it hovers around $368.
If BCH rallies and closes above $390.5 on a daily basis, it could extend the rally by 17% from that level to retest its next resistance level at $459.20.
The RSI on the daily chart reads 61, above its neutral level of 50, indicating bullish momentum. Like ALGO, the MACD indicator also displayed a bullish crossover, providing buy signals and indicating a potential continuation of the upward trend.
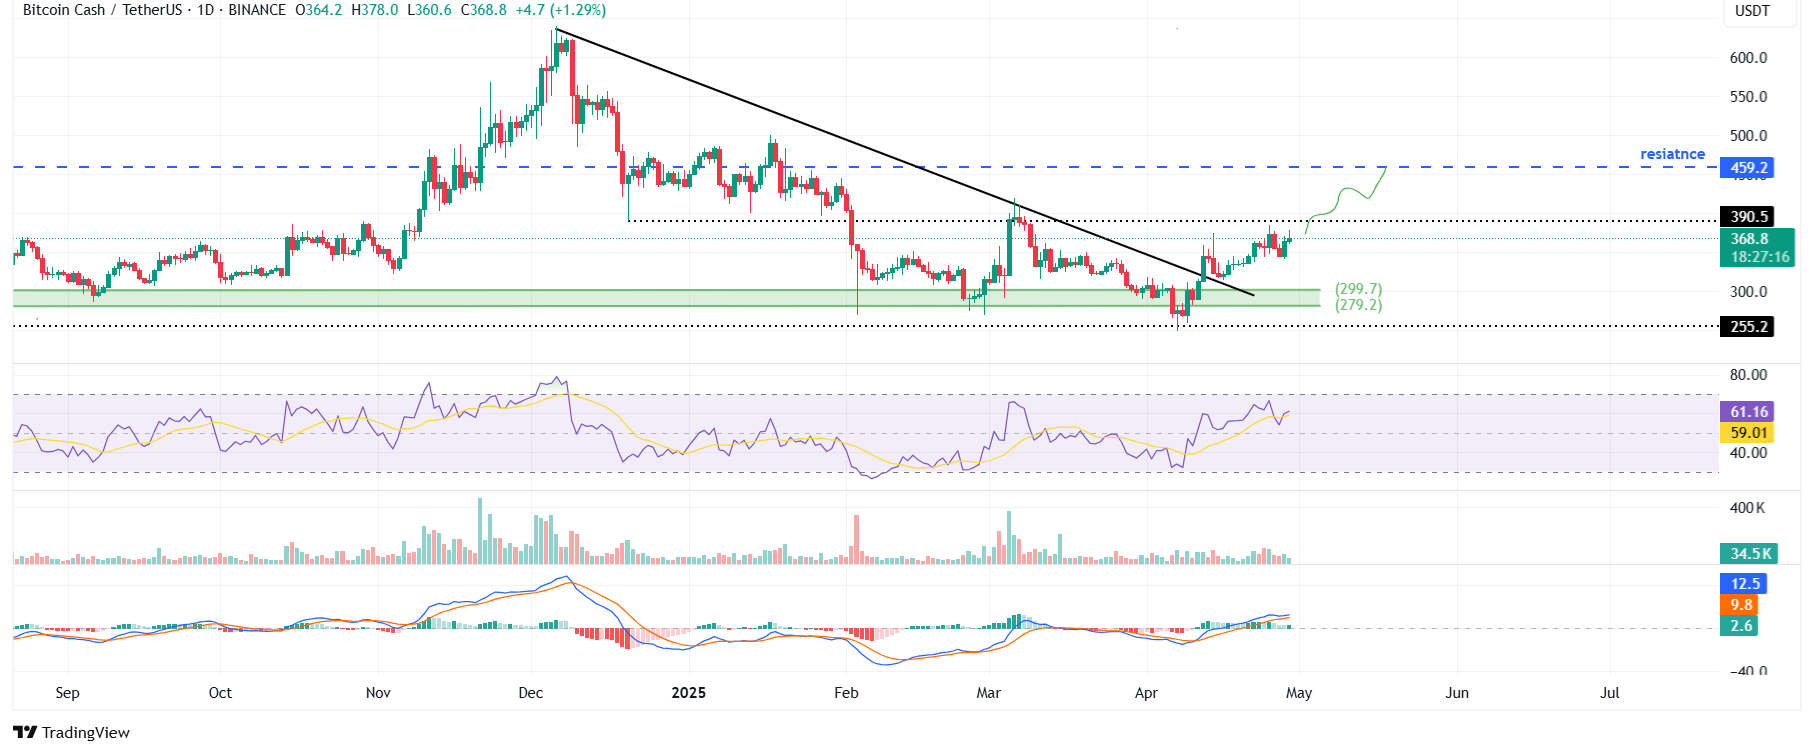
BCH/USDT daily chart
Santiment's Daily Active Addresses index, which helps track network activity over time, aligns with the bullish outlook noted from a technical perspective. A rise in the metric indicates increased blockchain usage while declining addresses suggest lower demand for the network.
In BCH's case, Daily Active Addresses have risen to a new all-time high of 4.13 million on Tuesday. This rise indicates that demand for BCH's blockchain usage is increasing, which could propel a rally in Bitcoin Cash's price.
 [11-1745906441816.10.15, 29 Apr, 2025].png)
BCH daily active addresses chart. Source: Santiment
Author

Manish Chhetri
FXStreet
Manish Chhetri is a crypto specialist with over four years of experience in the cryptocurrency industry.




