Monero Price Forecast: XMR soars over 50% amid rising demand for privacy coins
- Monero price extends its gains on Monday after rallying 9.33% the previous week.
- The main reason for the rally is speculation that 3,520 BTC stolen funds were laundered through over six instant exchanges and converted into Monero.
- On-chain metrics paint a bullish picture, with open interest reaching its highest level since December 20.
- The technical outlook suggests a continuation of the rally with a target of $345.

Monero (XMR) price is extending its gains by 50% at the time of writing on Monday, following a 9.33% rally the previous week. The main reason for XMR’s rally is speculation that the token, which is widely known for its status as a privacy coin, was used to launder a suspected theft involving 3,520 BTC worth $330.7 million, as highlighted by crypto investigator ZachXBT on X. The stolen funds were laundered through over six instant exchanges and converted into Monero.
On-chain metrics support this price surge, with XMR’s open interest reaching its highest level since December 20. The technical outlook suggests a bullish breakout and continuation of the rally, with a target of $345.
Why is Monero rallying today?
ZachXBT, a crypto investigator, posted on X that a massive 3,520 BTC, worth approximately $330.7 million, transfer was potentially a theft. The funds were laundered through over six instant exchanges and swapped for Monero, which caused a 50% price spike in XMR due to the sudden demand.
Nine hours ago a suspicious transfer was made from a potential victim for 3520 BTC ($330.7M)
— ZachXBT (@zachxbt) April 28, 2025
Theft address
bc1qcrypchnrdx87jnal5e5m849fw460t4gk7vz55g
Shortly after the funds began to be laundered via 6+ instant exchanges and was swapped for XMR causing the XMR price to spike…
Monero could surge as it breaks above the ascending triangle formation
Monero price breaks above the ascending triangle formation on the daily chart, rallying over 19% at the time of writing on Monday. This pattern was created by drawing two trendlines from mid-November, connecting swing points on the daily chart between multiple higher lows and multiple equal highs.
This technical pattern breakout favors the bulls, and the target is generally obtained by measuring the distance between the first daily high and the first daily low to the breakout point.
If the breakout level is retested and support is found around the daily level of $241.95, XMR could rally toward its technical target of $345.23. However, traders are suggested to book profits around the $300 level.
The Relative Strength Index (RSI) momentum indicator on the daily chart reads at 83, above its overbought level of 70, suggesting the ongoing rally could face cooling pressures. However, the bullish momentum remains strong.
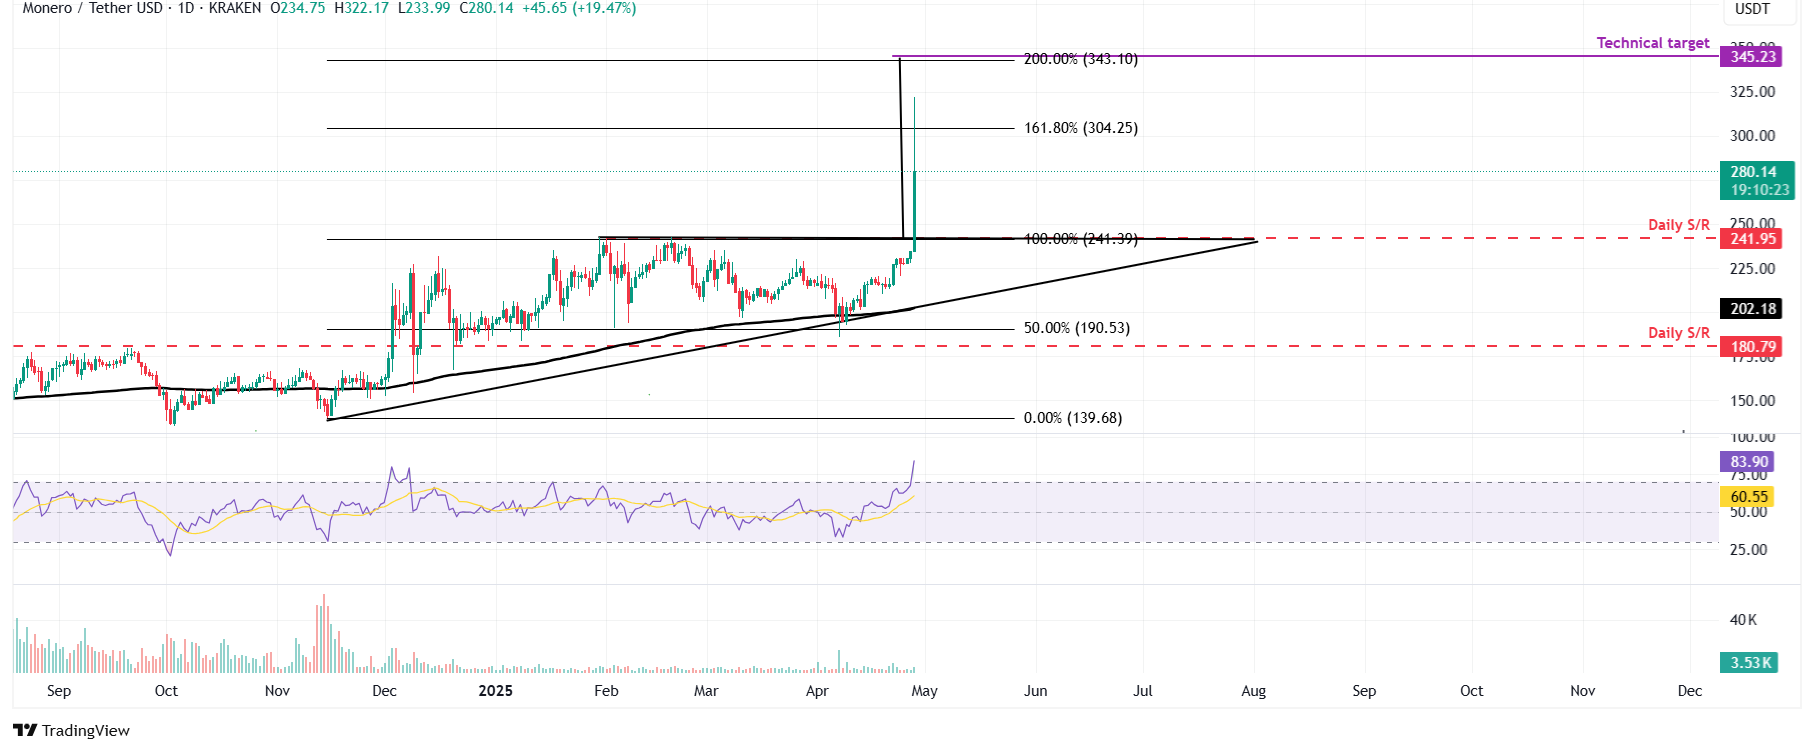
XMR/USDT daily chart
Monero’s open interest reaches its highest year-to-date
Monero’s Open Interest (OI) further supports the bullish outlook. Coinglass’ data shows that the futures’ OI in XMR at exchanges rose from $20.13 million on Friday to $30.38 million on Monday, reaching a new year-to-date (YTD) high. An increasing OI represents new or additional money entering the market and new buying, which suggests a rally ahead in the Monero price.
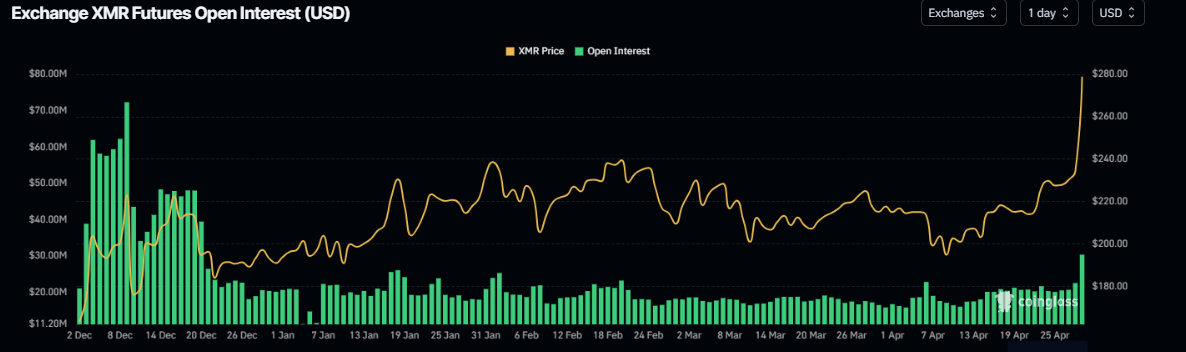
XMR open interest chart. Source: Coinglass
Author

Manish Chhetri
FXStreet
Manish Chhetri is a crypto specialist with over four years of experience in the cryptocurrency industry.


