Altcoins market turns red as Ethereum drops below $3,700: Memecore and Story hold gains
- Ethereum’s drop below $3,700 triggers a broader market pullback.
- MemeCore maintained double-digit gains from Wednesday, hinting at a potential range breakout.
- Story’s wedge breakout rally gains momentum, eyes further gains.

Memecore (M) and Story (IP) edge higher at press time on Thursday, holding onto the gains from Wednesday as the altcoins market turns red. The technical outlook indicates a bullish incline as Memecore hints at a potential range breakout and Story’s wedge breakout rally gains traction.
However, as Ethereum (ETH) slips under $3,700, coins like Floki (FLOKI), Pump.fun (PUMP) and Jasmycoin (JASMY) are leading the fall with double-digit losses.
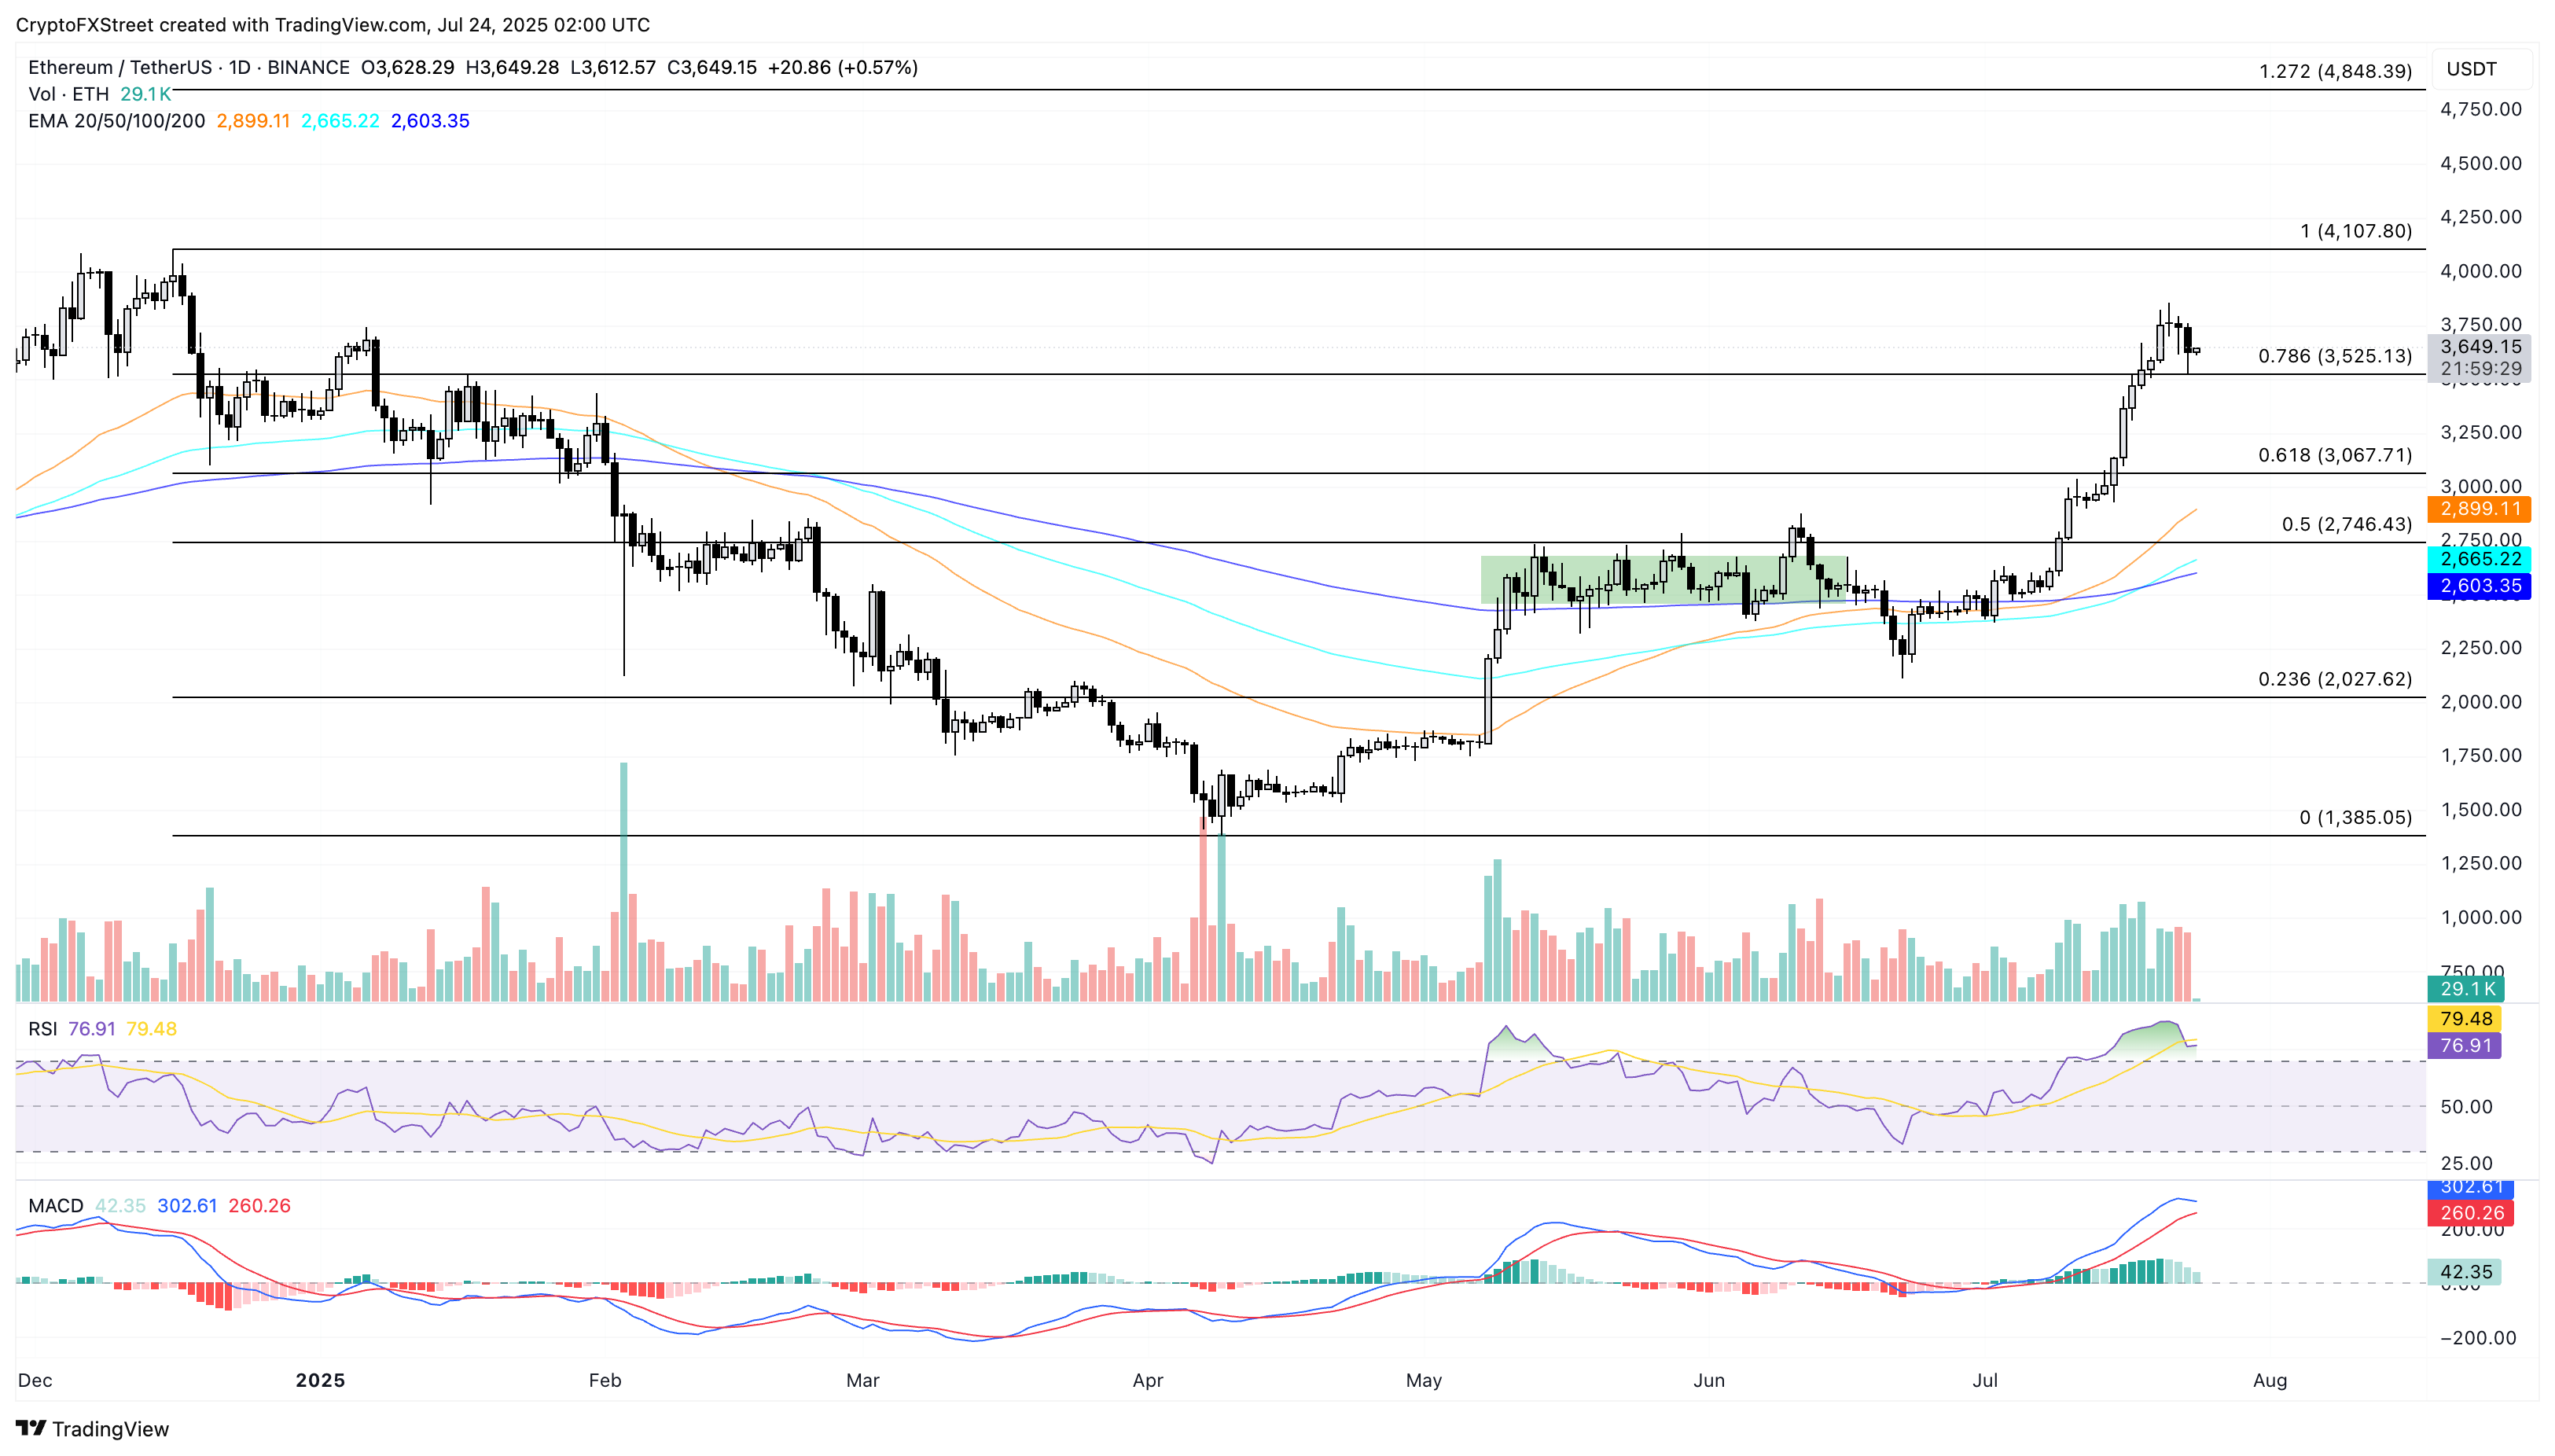
Ethereum edges higher marginally so far on Thursday after testing the 78.6% Fibonacci level at $3,525 (drawn from $4,107 on December 16 to $1,385 on April 9) with Wednesday’s low. The lower shadow on the previous daily candle reflects the demand at a key support level.
If Ethereum upholds the bullish momentum, it could test the $4,000 psychological mark.
Still, the Moving Average Convergence/Divergence (MACD) and its signal line inch closer to a reversal crossover as green histograms decline. The Relative Strength Index (RSI) reads 76 on the daily chart, indicating overbought conditions.
ETH/USDT daily price chart.
On the downside, if ETH marks a decisive close below the $3,525 level, it could extend the declining trend to the 61.8% level at $3,067.
Memecore struggles to escape the sideways range
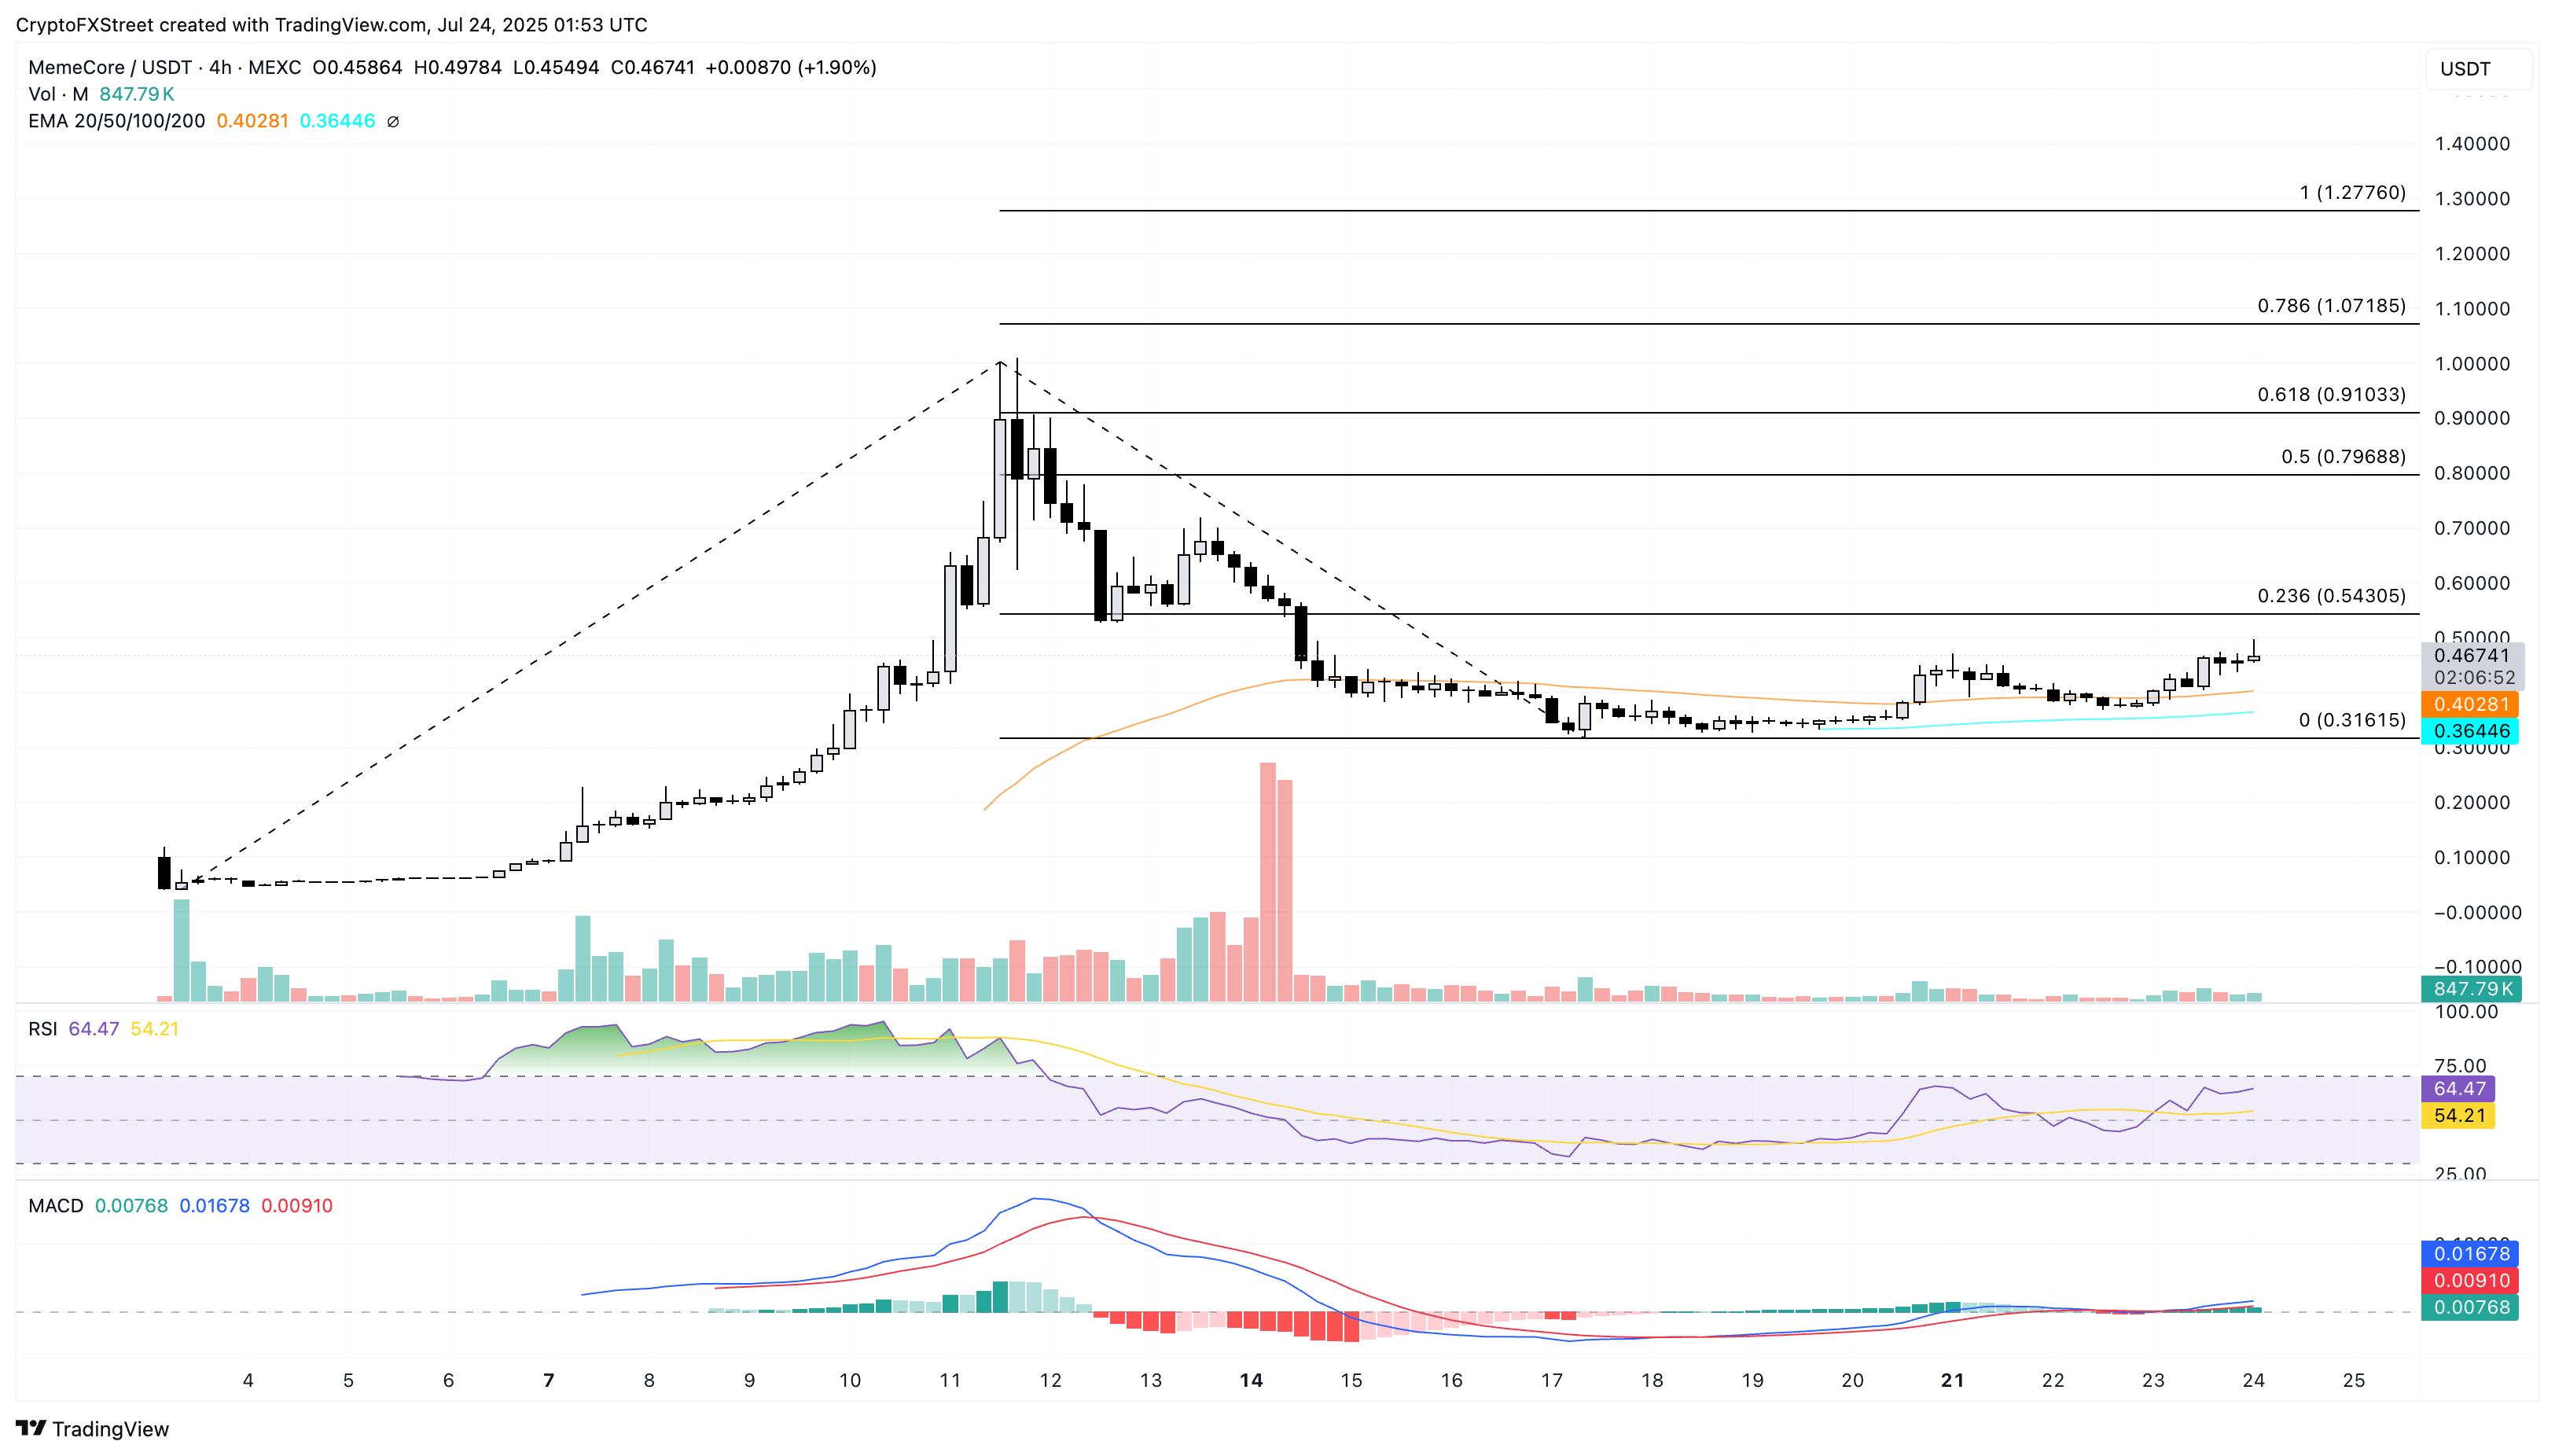
Memecore edges higher at press time on Thursday within a sideways track on the 4-hour price chart. The recent recovery targets the 23.60% trend-based Fibonacci level at $0.5430 as Memecore inches closer to the $0.5000 psychological level.
A potential close above this level would mark the breakout from a sideways range, potentially targeting the 50% Fibonacci level at $0.7968.
The MACD indicator displays a rising trend of green histogram bars, indicating a growing bullish momentum. Still, the RSI at 64 hovers flat below the overbought boundary line, indicating a stall in buying pressure.
M/USDT 4-hour price chart.
On the flipside, a reversal in Memecore could retest the 50-period Exponential Moving Average (EMA) at $0.4028.
Story’s wedge breakout rally targets $6.16
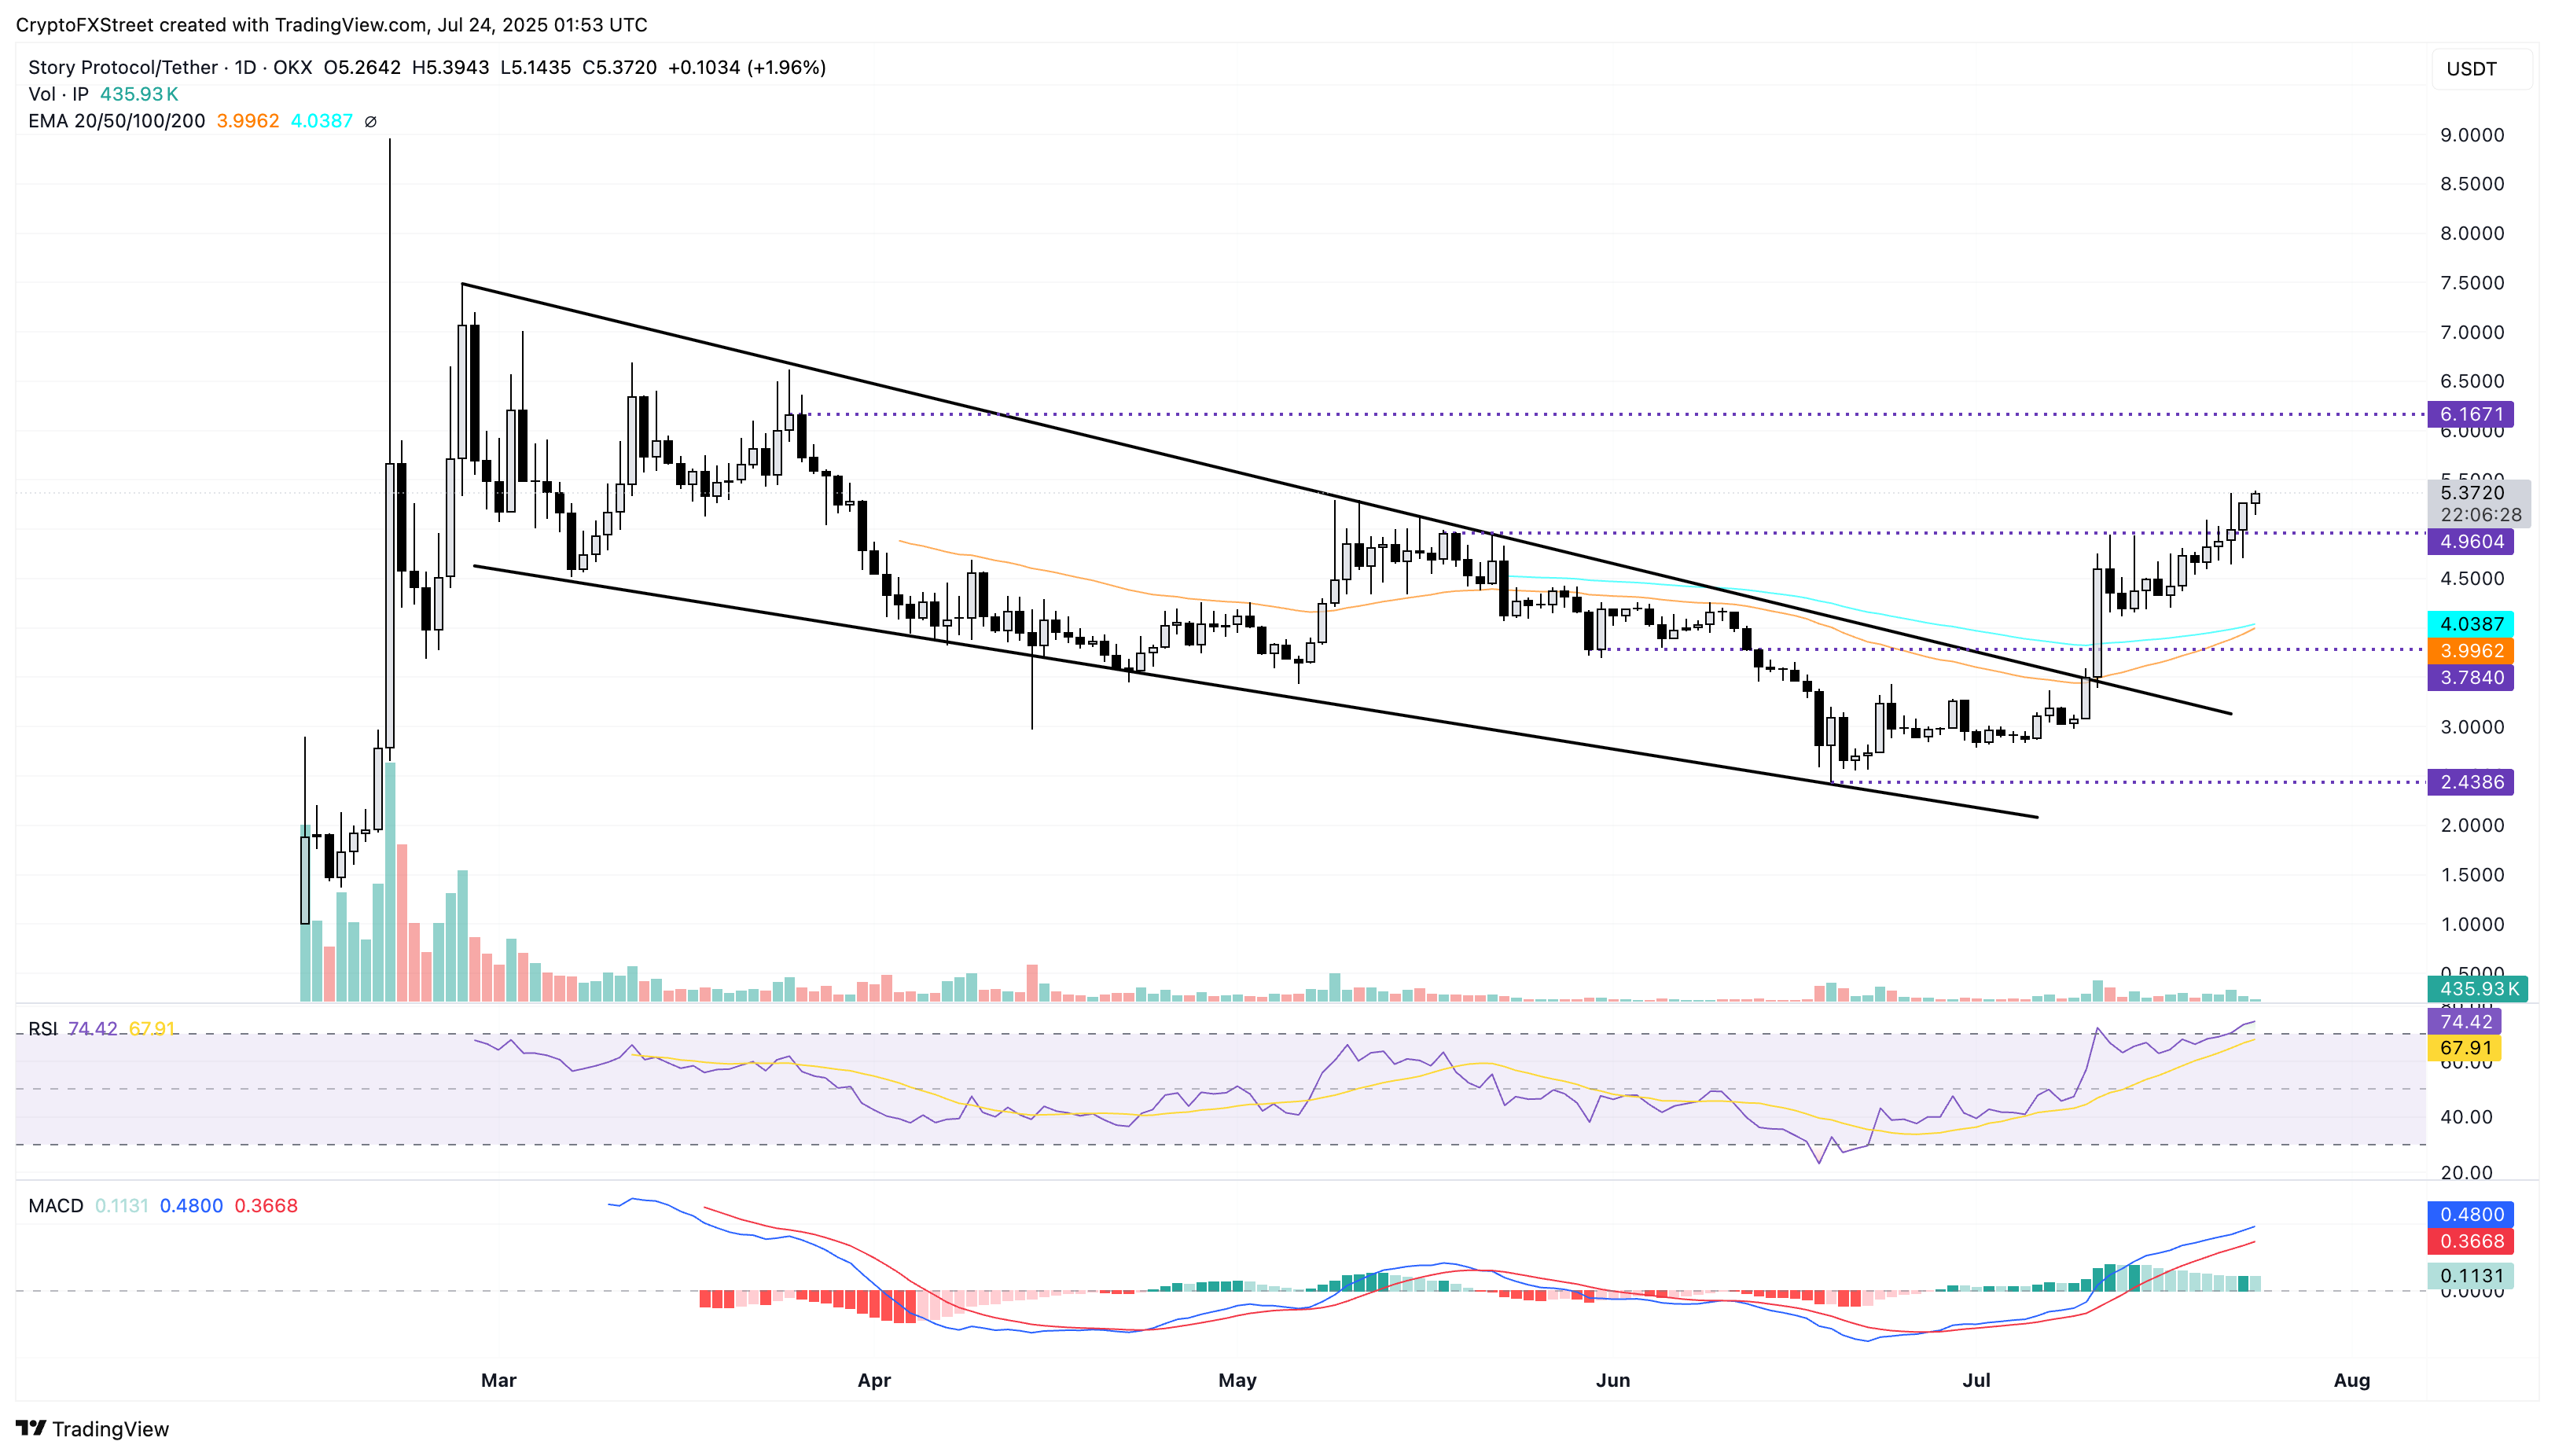
Story edges higher by nearly 2% at press time on Thursday, printing its fifth consecutive bullish candle. The wedge breakout rally on the daily chart gains traction as it crosses above the $5.00 psychological mark.
IP targets the $6.16 resistance level marked by the close of March 25 as the bullish run continues.
The 50-day EMA draws closer to surpassing the 100-day EMA, a potential buy signal as a short-term rally outpaces the longer-term trend.
The technical indicators suggest a boost in bullish momentum as the green histogram bars surge in the MACD indicator and the RSI at 74 enters the overbought zone amid increased buying pressure.
IP/USDT daily price chart.
On the contrary, a reversal in the Story below the $4.96 support level could test the 100-day EMA at $4.03.
Author

Vishal Dixit
FXStreet
Vishal Dixit holds a B.Sc. in Chemistry from Wilson College but found his true calling in the world of crypto.



