AAVE could see a massive rally if it completes key bullish move
- AAVE's price is showing strength again after potentially washing away weak hands following price dips in mid-July and August 2.
- On-chain metrics show long-term holders are unwilling to sell despite recent price rally.
- AAVE could rally above its yearly high of $154.86 if it breaks above the horizontal line of an ascending triangle.
- A daily candlestick close below the support around $84 will invalidate the bullish thesis.

AAVE is up more than 2% on Friday after seeing a slight correction from a rally earlier in the day. The move follows key on-chain metrics and an ascending triangle pattern, indicating AAVE's potential to see a massive rally in the coming days.
AAVE's on-chain metrics shows long-term holders anticipate higher price increase
The Realized Capitalization values each coin based on its last transacted price. AAVE's Realized Cap shows its capitulation event occurred on July 16, when investors sold off their tokens. This occurred after AAVE rallied nearly 40% between July 5 - 15.
After a brief correction, AAVE rallied until August 2, when the market dip saw most investors realizing profits and losses.
The recent price movements may have washed away weak hands as the 365-day Market Value to Realized Value (MVRV) Ratio shows most long-term holders are 17.5% in profits.
The 365-day Market Value to Realized Value (MVRV) Ratio measures the profits or losses of all coins purchased within the last year. An increase in this metric above 0 indicates LTHs are in profit and vice versa if it decreases.
 [00.23.29, 17 Aug, 2024]-638594490416831962.png)
AAVE MVRV (365d), Dormant Circulation (365d)
Despite the recent price rise, AAVE's 365-day Dormant Circulation, which measures the movement of coins last transacted in the past year, is at low levels, indicating unwillingness from long-term holders to sell. This indicates anticipation of future price increases from this cohort.
AAVE is forming an ascending triangle
On the daily chart, AAVE seems to be forming an ascending triangle pattern after making a series of higher lows based on the rising trendline starting from July 5. The only outlier was the wider crypto market crash on August 5.
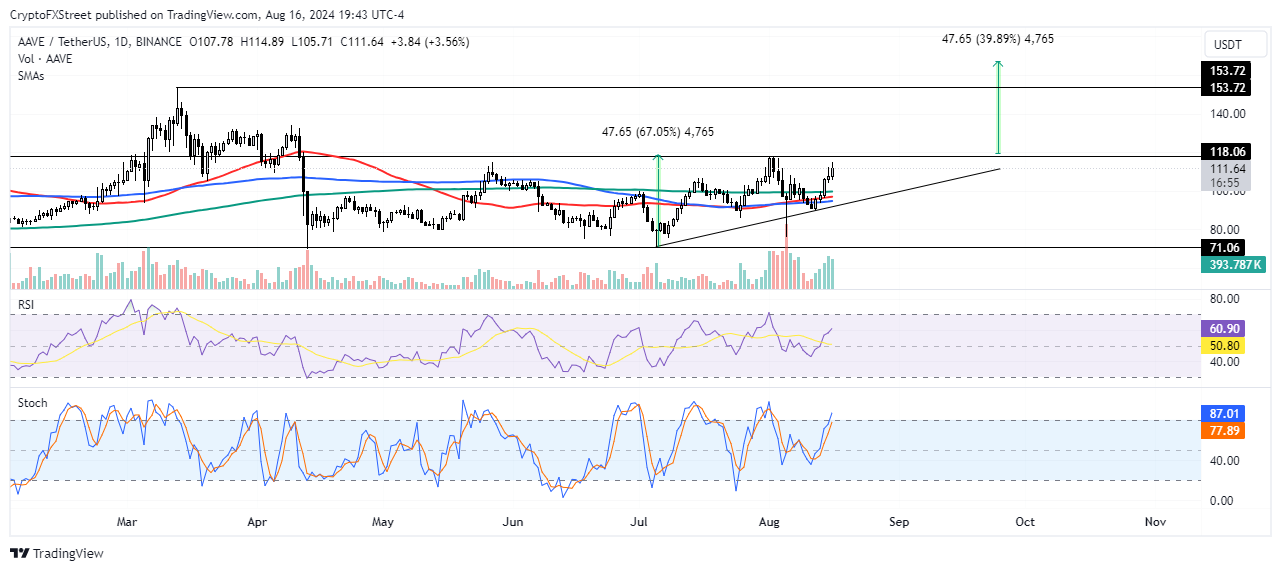
AAVE/USDT Daily chart
However, it has continued the move and is attempting to break out of the horizontal line resistance at $118.71. A successful move above this level could see AAVE rise above its yearly high resistance of $154.86 on March 13. AAVE could rise as high as $167.82 if it completes this move.
The Relative Strength Index (RSI) which has risen above its midpoint and its moving average could provide tailwinds for this move.
However, the Stochastic Oscillator is in the oversold region, indicating that AAVE could see a correction.
A daily candlestick close below the support around $84 will invalidate the bullish thesis.
Author

Michael Ebiekutan
FXStreet
With a deep passion for web3 technology, he's collaborated with industry-leading brands like Mara, ITAK, and FXStreet in delivering groundbreaking reports on web3's transformative potential across diverse sectors. In addition to


