Yes, the SP500 is climbing a wall of worry right now

Stocks entered last week on a weak note, but smartly dusted themselves off after Tuesday’s slide. As the week ended close to unchanged in the S&P 500 futures, what clues does the detailed assessment of their performance and the fundamental situation offer?
Let’s start with the index itself, and check the weekly and daily perspectives.
SP500 in the Medium- and Short-Run
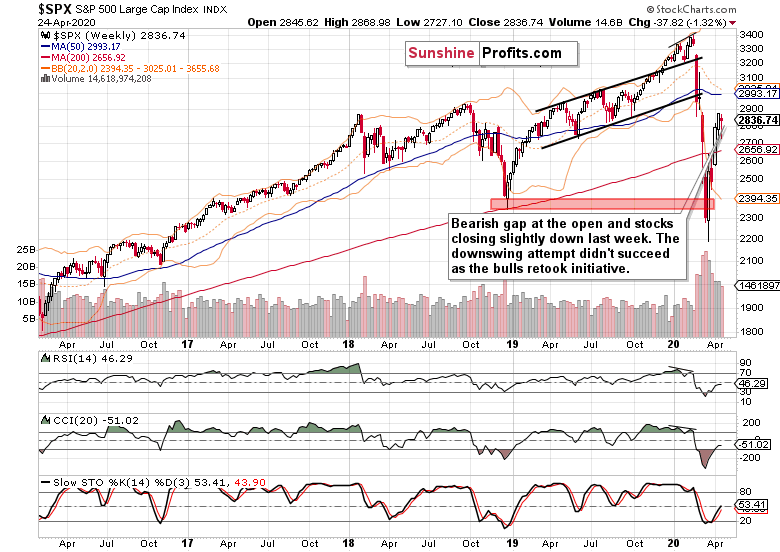
The week started with a bearish gap and onslaught of the bears. Since Wednesday though, stocks have erased the sizable decline and closed little changed from where they opened.
While the weekly indicators are on their buy signals, the volume isn’t really sending strong signals either way. Viewed from the weekly perspective, the rally could be either consolidating prior gains before another upleg, or stalling before turning lower.
Let’s check the daily chart to see whether the weekly lower knot is a sign of strength of the bulls or their last gasp attempt to stem the coming decline.
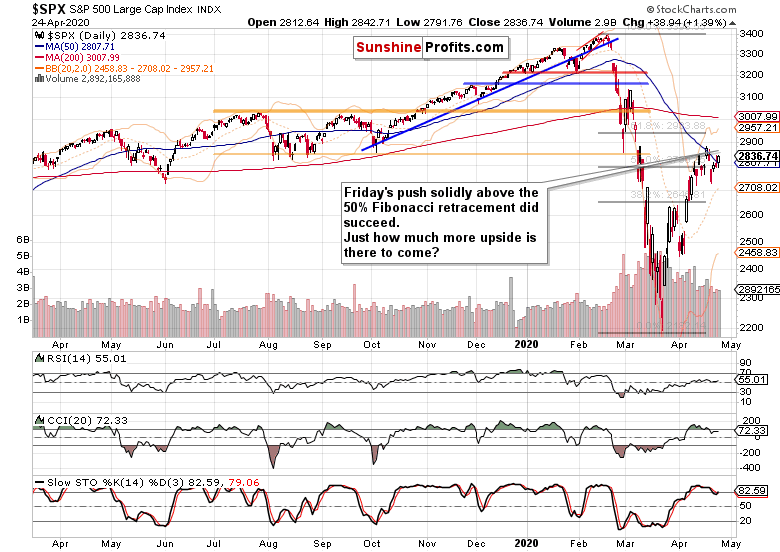
The daily perspective helps refine the broad picture and to choose between the two options above. After Thursday’s hesitation at the 50% Fibonacci retracement, stocks retested it, jumped higher and haven’t looked back since. It’s encouraging for the bulls to see a strong finish to Friday’s session that also took prices above the 50-day moving average.
Volume is leaning slightly in support of the bullish case, and the daily indicators are trying hard to shake off their prior bearish overtones. Still in a precarious position though, such posture can support both the upswing continuation or its consolidation.
Only a decisive downswing below the 50% Fibonacci retracement on high volume coupled with prospects of further declines, would change the bullish-to-neutral takeaway. Currently, we see none of that – instead, there’s still potential for the rally to go on.
As the S&P 500 struggled at the 50% Fibonacci retracement, we asked on Friday whether stocks have rolled over and:
(…) kept moving down when faced with grim incoming economic and coronavirus news? No, it rather appears to be shaking them off. Stocks are actually quite resilient, just as they were in early April with all the 12-month plus lockdown speculations making the rounds and no economy reopening hopes in sight.
Perhaps this means that the market now actually wants to go higher. Does that mean we have a bull market? While it’s encouraging that the market doesn’t really sell off on bad news, the present upswing (stabilization at higher levels) may still turn out to be a bullish leg up within a trading range that spans over weeks and potentially months.
The Credit Markets’ Point of View
Let’s check now the high yield corporate bonds to short-term Treasuries ratio.
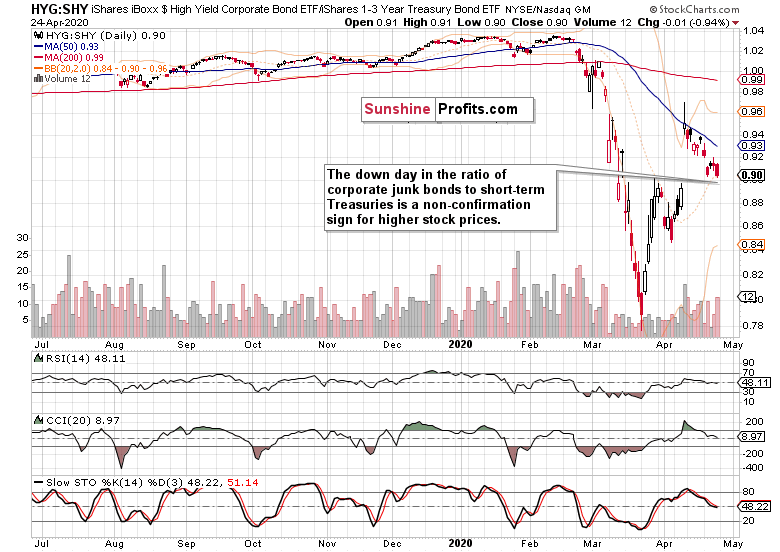
The stock upswing isn’t confirmed as the ratio is lagging behind. But is the non-confirmation as dire as it might appear at this chart?
Let’s overlay the above ratio with the S&P 500 and take a look at the recent past.
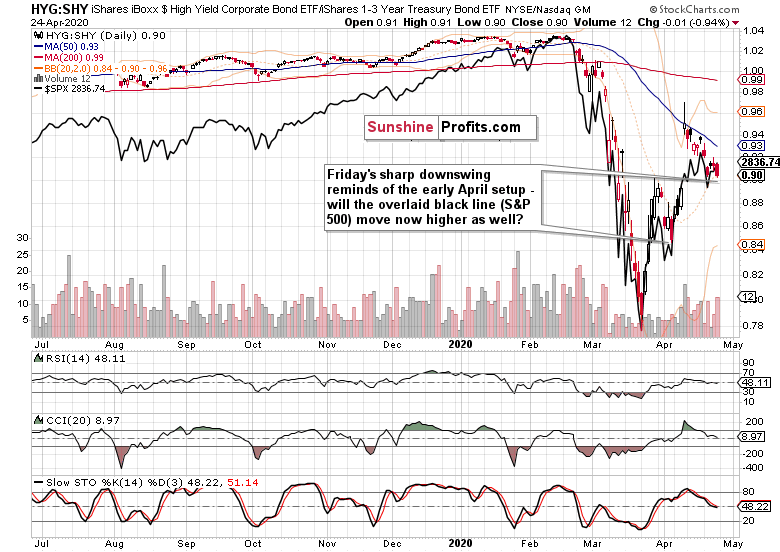
In early April, the ratio had also been on a downswing, and on Apr 3 (also Friday, by the way), it hit a new low while stocks didn’t. Should the recent history repeat itself, we could be looking at credit markets again leading stocks higher.
Next, let’s take a look at the individual performance of high yield corporate bonds (HYG ETF) and short-dated Treasuries (SHY ETF).
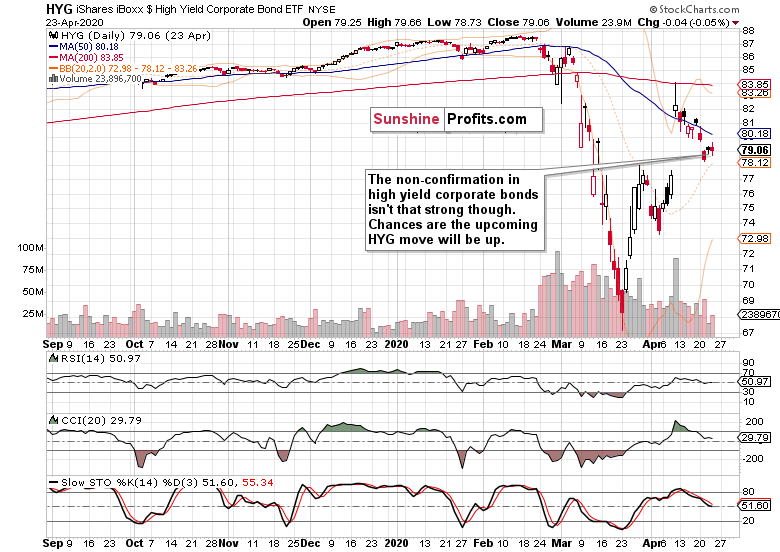
Junk corporate bonds closed almost unchanged – they’re not leading down. It rather appears they’re taking a breather before the next move. There’s a very good chance it’ll be up.
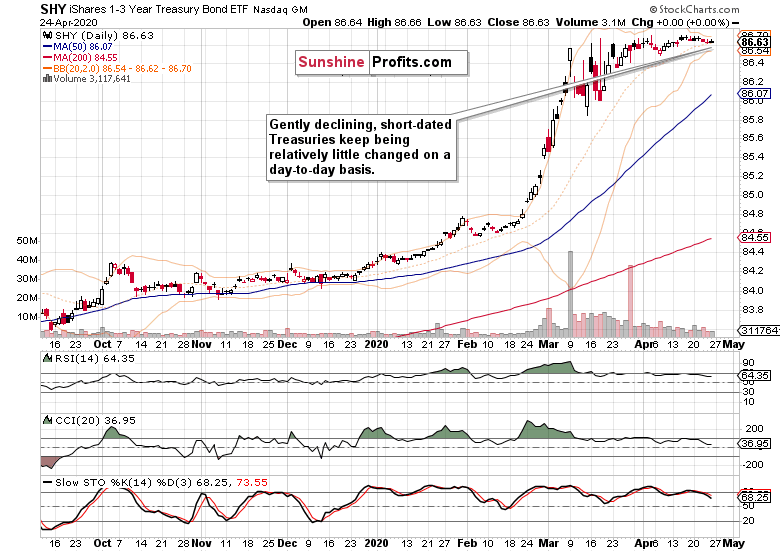
The fact that short-term Treasuries are overall moving lower in recent days (and not rising sharply as investors seek shelter), tips the scales in favor of an upswing in riskier assets such as corporate bonds or stocks.
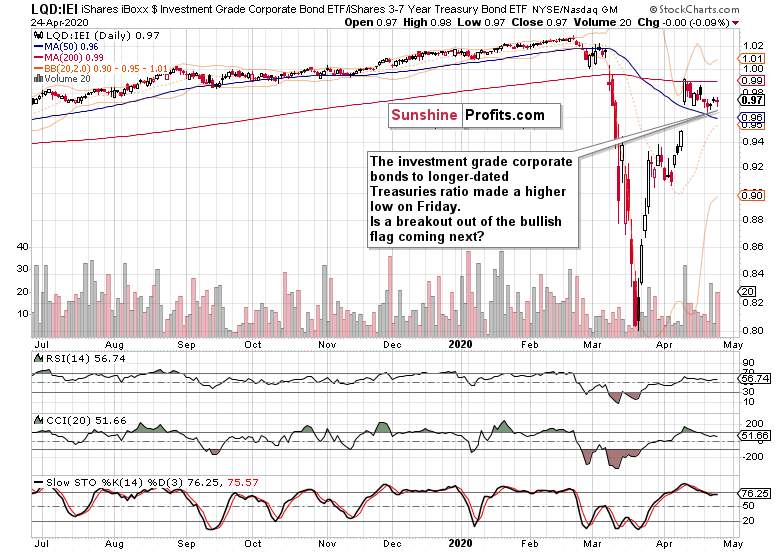
The ratio of investment grade corporate bonds to longer-dated Treasuries also speaks in favor of the upswing to continue. Unlike the ratio of junk corporate bonds to short-term Treasuries, it has made a higher low on Friday, and appears ready to break out higher from its bullish flag formation. Seeing it lead in the upswing, is another point in support of higher stock prices.
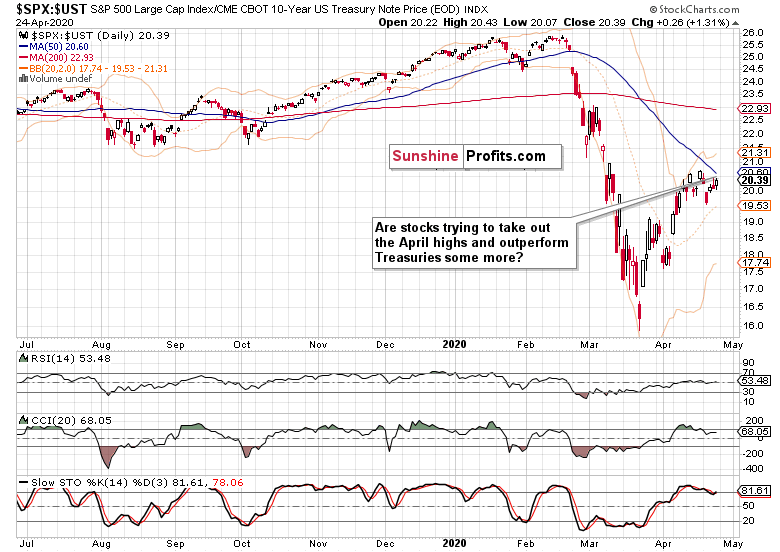
The ratio of stocks to Treasuries went higher, supporting the notion that risk-on is far from down and out. Should the ratio overcome the April highs, it would bode well for higher stock prices ahead.
Let’s dive into the S&P 500 sectors to assess the health of the most recent turnaround.
Key SP500 Sectors and Ratios in Focus
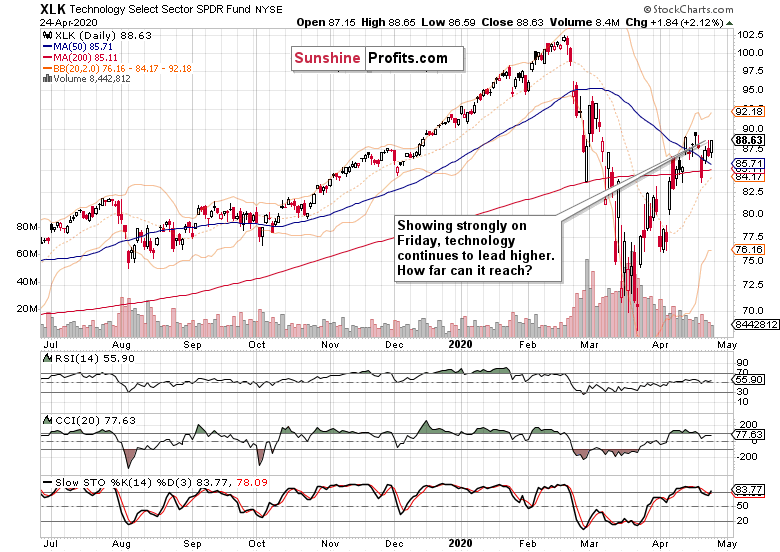
Technology is the sector that leads the index both up and down. While the lower volume warrants caution, technology is leading higher, and it can be seen also within its heavy-weight stocks such as Amazon (AMZN), Microsoft (MSFT), Alphabet (GOOG), Apple (AAPL) or even Intel (INTC). On Tuesday, Alphabet‘s earnings report is scheduled, Microsfoft is slated for Wednesday, and both Apple and Amazon on Thursday.
As technology goes, the S&P 500 goes. And the balance of risks within the sector points higher.
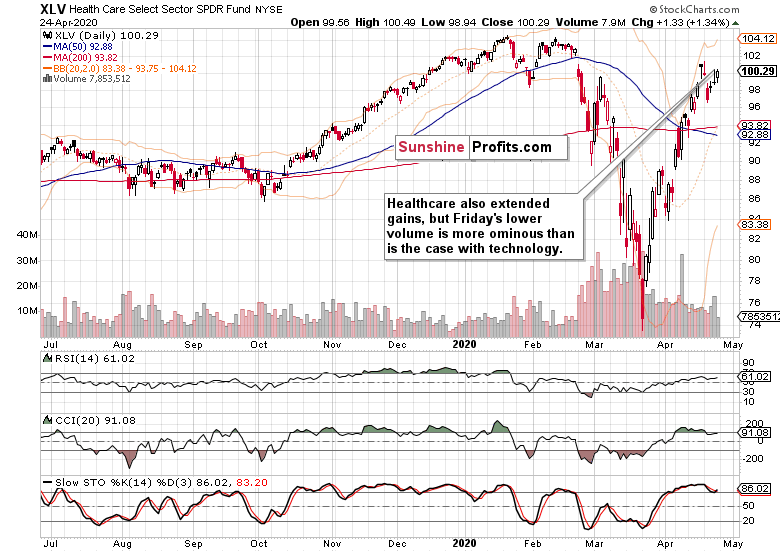
Healthcare is the other engine of the S&P 500 upswing. Again, the bullish price action is marked by the very low volume of Friday’s upswing and the extended daily indicators. Just as with technology, continuation of the move higher or consolidation of recent gains, are the most likely scenarios.
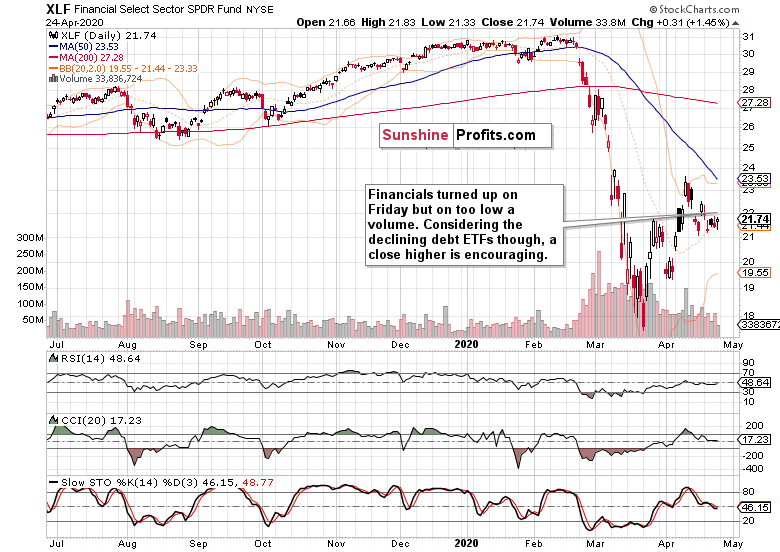
Financials don’t appear to be willing to decline much further these days. On low volume, they have even turned slighly higher in their tight trading range. In our opinion, they’re basing here just as high yield corporate bonds are. Odds are that their next move will be higher.
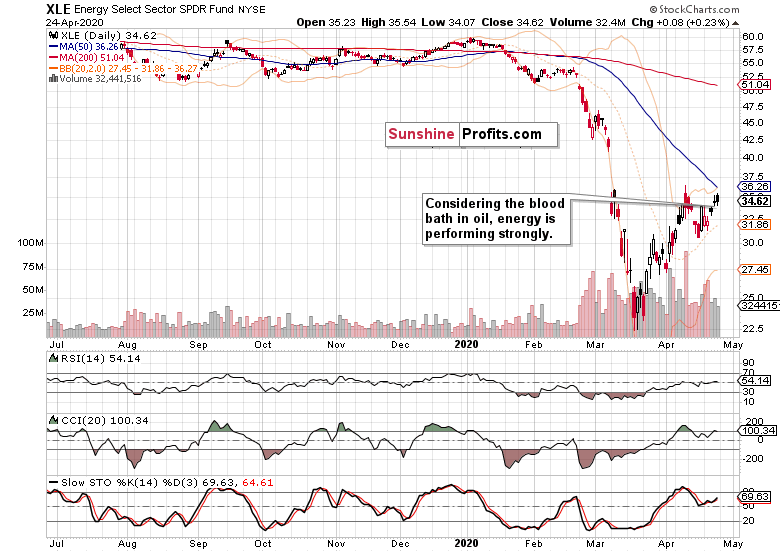
Given the turmoil in black gold, energy is a bright spot, and an example of a sector that leads the index higher as it closed the week in the black.
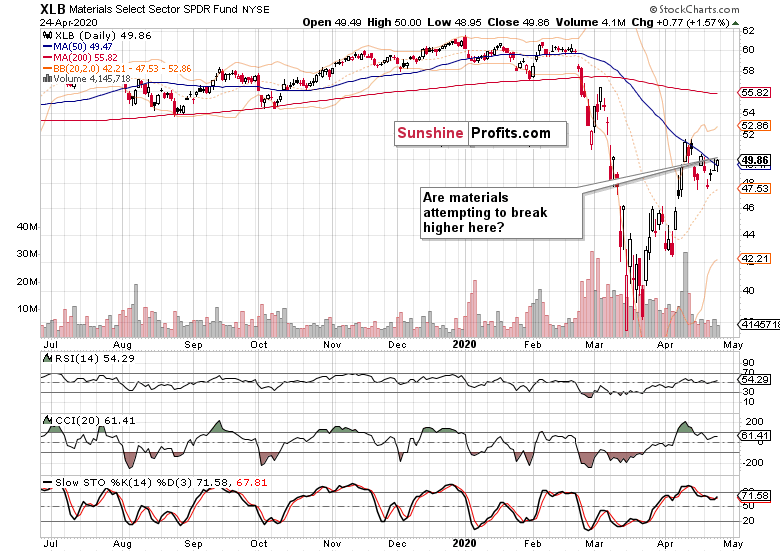
Materials also finished the week with a positive result. And just as with energy, the volume differential between their Friday upswing and the average daily volume in the week, wasn’t as stark as with the three heavy-weight sectors. Therefore, chances are that technology, healthcare and financials will play catch up over the coming days.
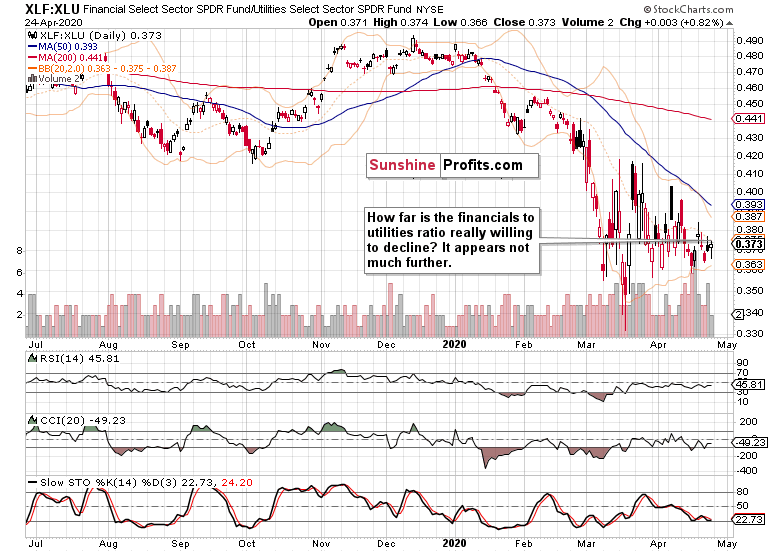
These were our Friday’s observations regarding the financials to utilities ratio:
(...) Despite yesterday’s S&P 500 decline, financials (XLF ETF) outperformed utilities (XLU ETF). This sends a subtly bullish message as it appears that the ratio isn’t really ready to move much lower.
Indeed, financials outperformed, and rejected the intraday move lower. As the financials are farthest away from what we could call an uptrend, this ratio is understandably still weak overall. Seeing it break above the declining resistance line formed by the March and April tops, will be a bullish development. If it breaks below the April lows, it would be a bearish omen. Until it break out in either direction, its implications are rather neutral, and paying attention to financials provides more clues.
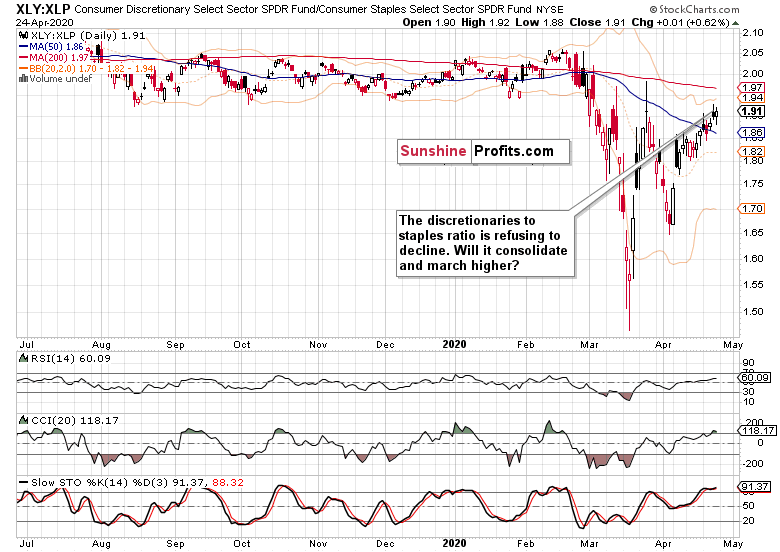
The dicretionaries to staples ratio provides more colorful insights. As well, it refused to roll over to the downside, and is slowly but surely marching higher in a gentle nod to the S&P 500 upswing.
The Fundamental S&P 500 Outlook
If we have seen a V-shaped recovery somewhere, it was in the stock market. The hopes and expectations of the economy reopening fuel the run, but will the real economy rebound as the V letter implies? We’re of the opinion that just as different states and major cities reopen to varying degrees at different points in time, so will the whole economy move. Currently, a U-shaped recovery is the most probable scenario in our opinion. We don’t exclude a W-shaped recovery either, though in that case, the right bottom would likely form above the left bottom of the letter W.
However, this means that stocks are trading at stretched valuations currently, and their reaction to the upcoming key technology companies’ earnings, is of key importance. Judging by how the S&P 500 took to this week’s reports batch, the takeaway is encouraging. Sure, the unemployment data are dismal, Great Depression-like - and we see it cascading well beyond the usual corona-impacted suspects such as airlines, tourism and the like. The brick-and-mortal retail was on the ropes even before the pandemic played into the Amazon hands. Yes, big business is downsizing and many small businesses won’t reopen.
As the economic destruction is unprecedented, central banks don’t stand idle. And they won’t in the future either. Joined by fiscal policy moves, how long will it take for another stimulus package to hit the waves? It must be in the works already.
Let’s keep in mind that we’re trading the stock market, and not the real economy. We have to watch the S&P 500 price action and money flows. Once the sharp sell-off ended in late March, it’s not out of the unexpected to see a reflexive rally up to the 50% Fibonacci retracement. Even dead cats bounce.
But we’ve seen quite a few rejections of prices returning back lower. The upswing certainly hasn’t been reversed to the downside, and while the breakout above this retracement hasn’t been confirmed by three consecutive closes yet, there are encouraging signs that it would continue upwards.
Will people take profits as prices approach the nearest strong resistances such as the 61.8% Fibonacci retracement or the early March bearish gap? The best we can do is to look at the money trail not merely on a day-to-day basis – should it deteriorate (coupled with warning signs from the S&P 500 sectoral analysis), it would be the best signal available to get out of our increasingly profitable long positions.
No one has a crystal ball and can say with 100% certainty that this or that, major or minor, resistance will hold. It’s in the context and overall interpretation of all the above-discussed signals that the market sends. Plus the fundamental developments and headlines. The rally can both go higher, and still roll over to the downside in the coming weeks or months in a challenge of the 2200 lows. By the same token, the lows might be already in. The point is we have to trade the situation in the now, because there are so many moving parts to discount in the price. That’s for the present – and don’t forget about the unknown unknowns that will strike down the road either.
The current outlook is bullish but we have to stay nimble and continually ask ourselves whether our long position keeps making sense. Right now, it does.
From the Readers’ Mailbag
Q1: Do you see this bull run breaking down at 2880 or the 2930 .618 Fib? Last couple of days felt very weak especially on volume.
Q2: Do you still hold a downside target of 2200? I’m concerned with how far VIX fell today. Do you foresee it breaking above 2840 and 2880?
A: Please see the above three paragraphs for your answers.
Q: What do u think about S&P 500 pe ratio topping February's peak?
A: Sure, as earnings go down, the valuations are getting stretched. Yet the market looks over the valley and discounts the upcoming quarterly earnings, which means that the P/E ratio can still get ridiculously high if you consider real economy developments. But we’ve seen this in the Great Recession as well. Paying too much attention to the P/E ratio is best left to long-term investors. In the current environment, one has be flexible and ready to act on the many above-described technical indicators. We’re not in a buy-and-hold environment.
Summary
Summing up, S&P 500 closed the week back above the 50% Fibonacci retracement. While Friday’s upswing happened on lower volume (making it less credible), the key sectors and their ratios (financials to utilities, and especially discretionaries to staples) favor the upswing attempt to continue. Credit markets seem to be making a local bottom, and financials may be already acting on that. The ease with which bad news (economic or corona-related) are ignored, gives the bulls the benefit of (perhaps even more than) a short-term doubt. Stocks appear to be ready to move higher and our Thursday-initiated long position remains justified. Today’s premarket upswing points to a bullish gap at the open, lending further support to the bulls.
Want free follow-ups to the above article and details not available to 99%+ investors? Sign up to our free newsletter today!
Want free follow-ups to the above article and details not available to 99%+ investors? Sign up to our free newsletter today!
Author

Monica Kingsley
Monicakingsley
Monica Kingsley is a trader and financial analyst serving countless investors and traders since Feb 2020.


