Yearly technical outlook – Gold, USD/JPY, US 500 [Video]
- Gold forms year-end triangle: bullish bias intact, but rally is looking overstretched.
- US 500 index aims for more upside, but will it invalidate the bearish doji candlestick?
- USDJPY faces head-and-shoulders risk, but bearish confirmation sits lower.
![Yearly technical outlook – Gold, USD/JPY, US 500 [Video]](https://editorial.fxsstatic.com/images/i/USDJPY-neutral-line.png)

Gold
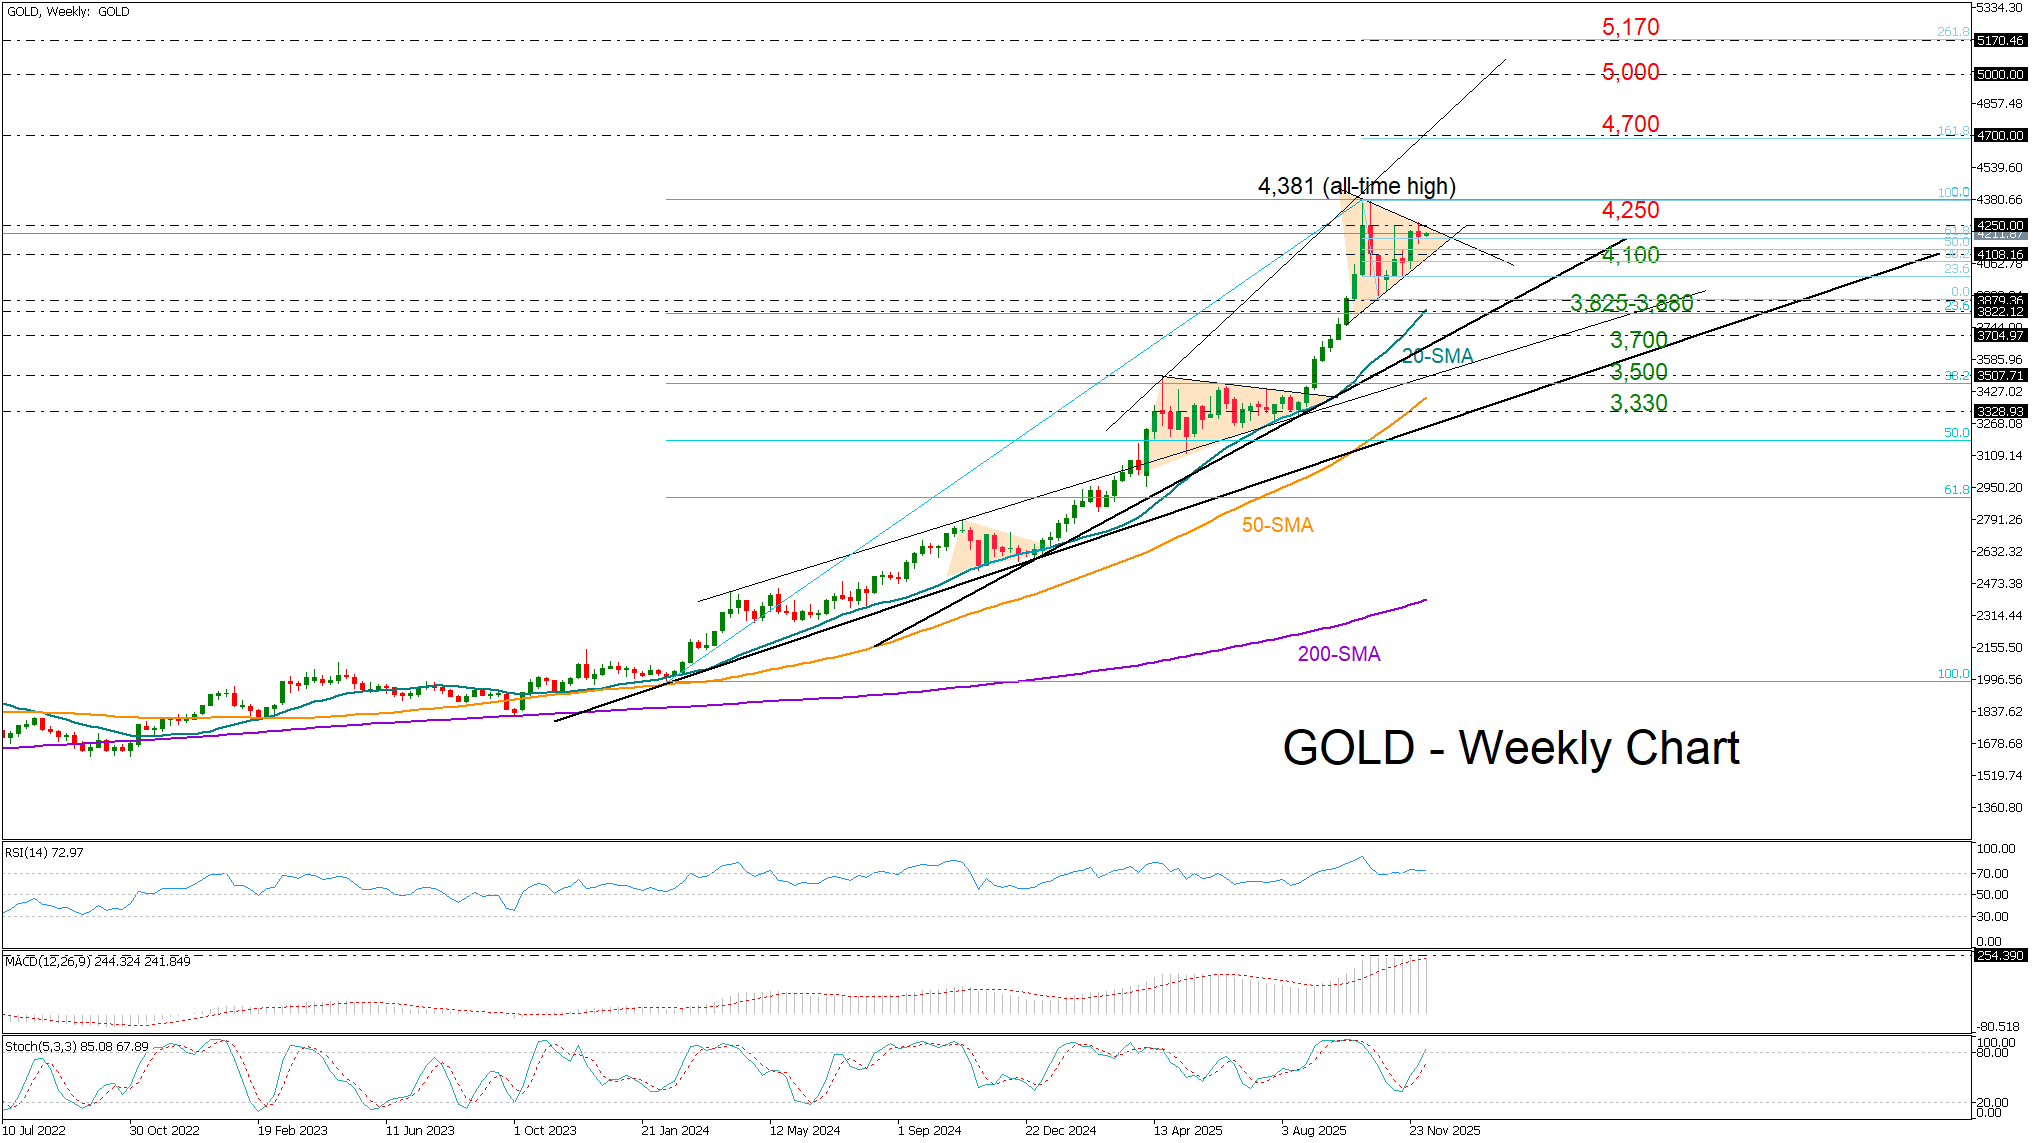
Gold is ending the year on fire, delivering its biggest annual gain since 1979. With a stunning 60% year-on-year rally and a new all-time high at 4,381 – powered by Fed rate-cut bets and persistent geopolitical uncertainty – traders are now asking the real question of whether the momentum can continue into 2026.
The technical backdrop remains bullish in the weekly chart. Gold is riding a powerful uptrend, but its stretched distance from the 50-weekly SMA at 3,330 (+25%) signals that the market may be due for a breather. The even wider gap from the 200-week SMA adds to the risk of cooling, especially if geopolitical tensions ease or stronger U.S. data slows the Fed’s easing path. Note that both the RSI and the stochastic oscillator are fluctuating near overbought levels, while the MACD’s steep ascend seems to be losing steam.
The price action seems to be developing again within a symmetrical triangle – a pattern that has repeatedly delivered strong breakouts since late 2024. A clean break above the upper boundary and 4,250 could ignite the next leg higher, opening the way toward 4,600–4,700, where the 161.8% Fibonacci extension awaits. A continuation toward 5,000–5,170 would not be out of the question if bullish momentum accelerates.
On the downside, a break below 4,100 would shift attention to 3,825–3,880. A move under 3,330 would put the broader uptrend under pressure and raise the stakes for a deeper correction.
US 500 index
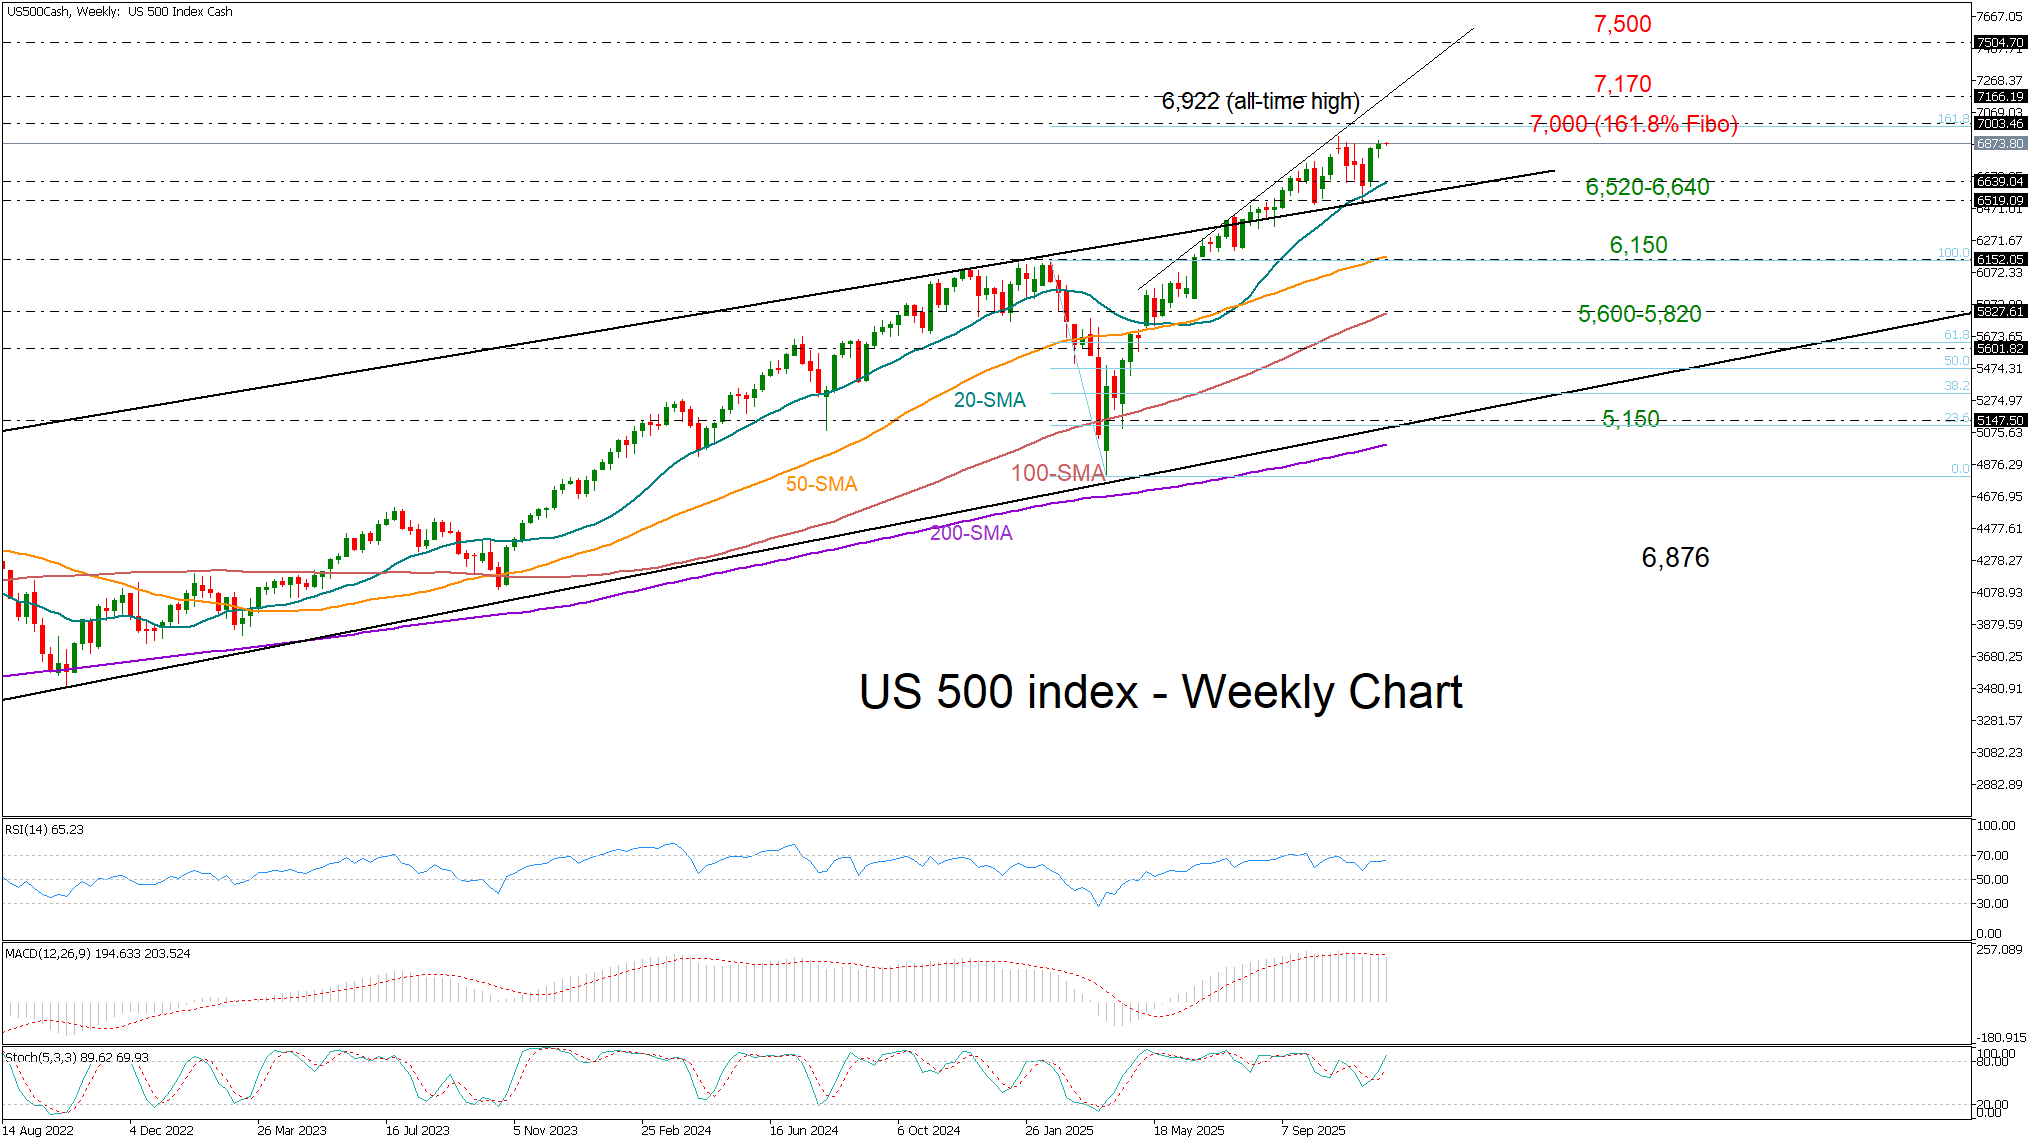
The US 500 index has managed to overcome several major challenges this year and is set to end in positive territory. Despite elevated valuations, the index pushed through Trump’s import-tariff announcements, a less-dovish Fed in early summer, recession concerns, and even a government-shutdown scare, reaching new all-time highs on the back of strong AI-driven innovation. With lower interest rates expected, continued enthusiasm for AI and data-center investment, upbeat earnings, and fiscal support through the Fed’s quantitative easing plans, the bull run could extend into 2026.
Last week’s strong rebound near the 20-weekly simple moving average (SMA) revived optimism for an upward continuation, defending the breakout of the long-term bullish channel. However, downside risks remain as the October 26 doji candlestick still signals hesitation. The wall between the 7,000 mark - the 161.8% Fibonacci extension of the previous downfall – and the resistance line at 7,170 may cap gains early next year, while a move toward 7,500 - near the 261.8% Fibonacci extension - would align with a typical 10% annual increase. A more aggressive rally could reach the 8,000–8,300 zone.
On the downside, valuation concerns tied to AI and heavy sector concentration could heighten volatility. A drop below 6,520 may trigger selling pressures toward the 50-weekly SMA at 6,150. Even lower, the 5,600-5,820 area could come into view. The broader question is whether the index will retest the long-term pandemic-era support trendline currently near 5,150 and the 200-weekly SMA. Recent tight consolidation after six straight monthly gains adds to the risk of a near-term pullback, especially as the trend in the RSI, the stochastic oscillator, and the MACD seem to be leaning to the downside.
USD/JPY
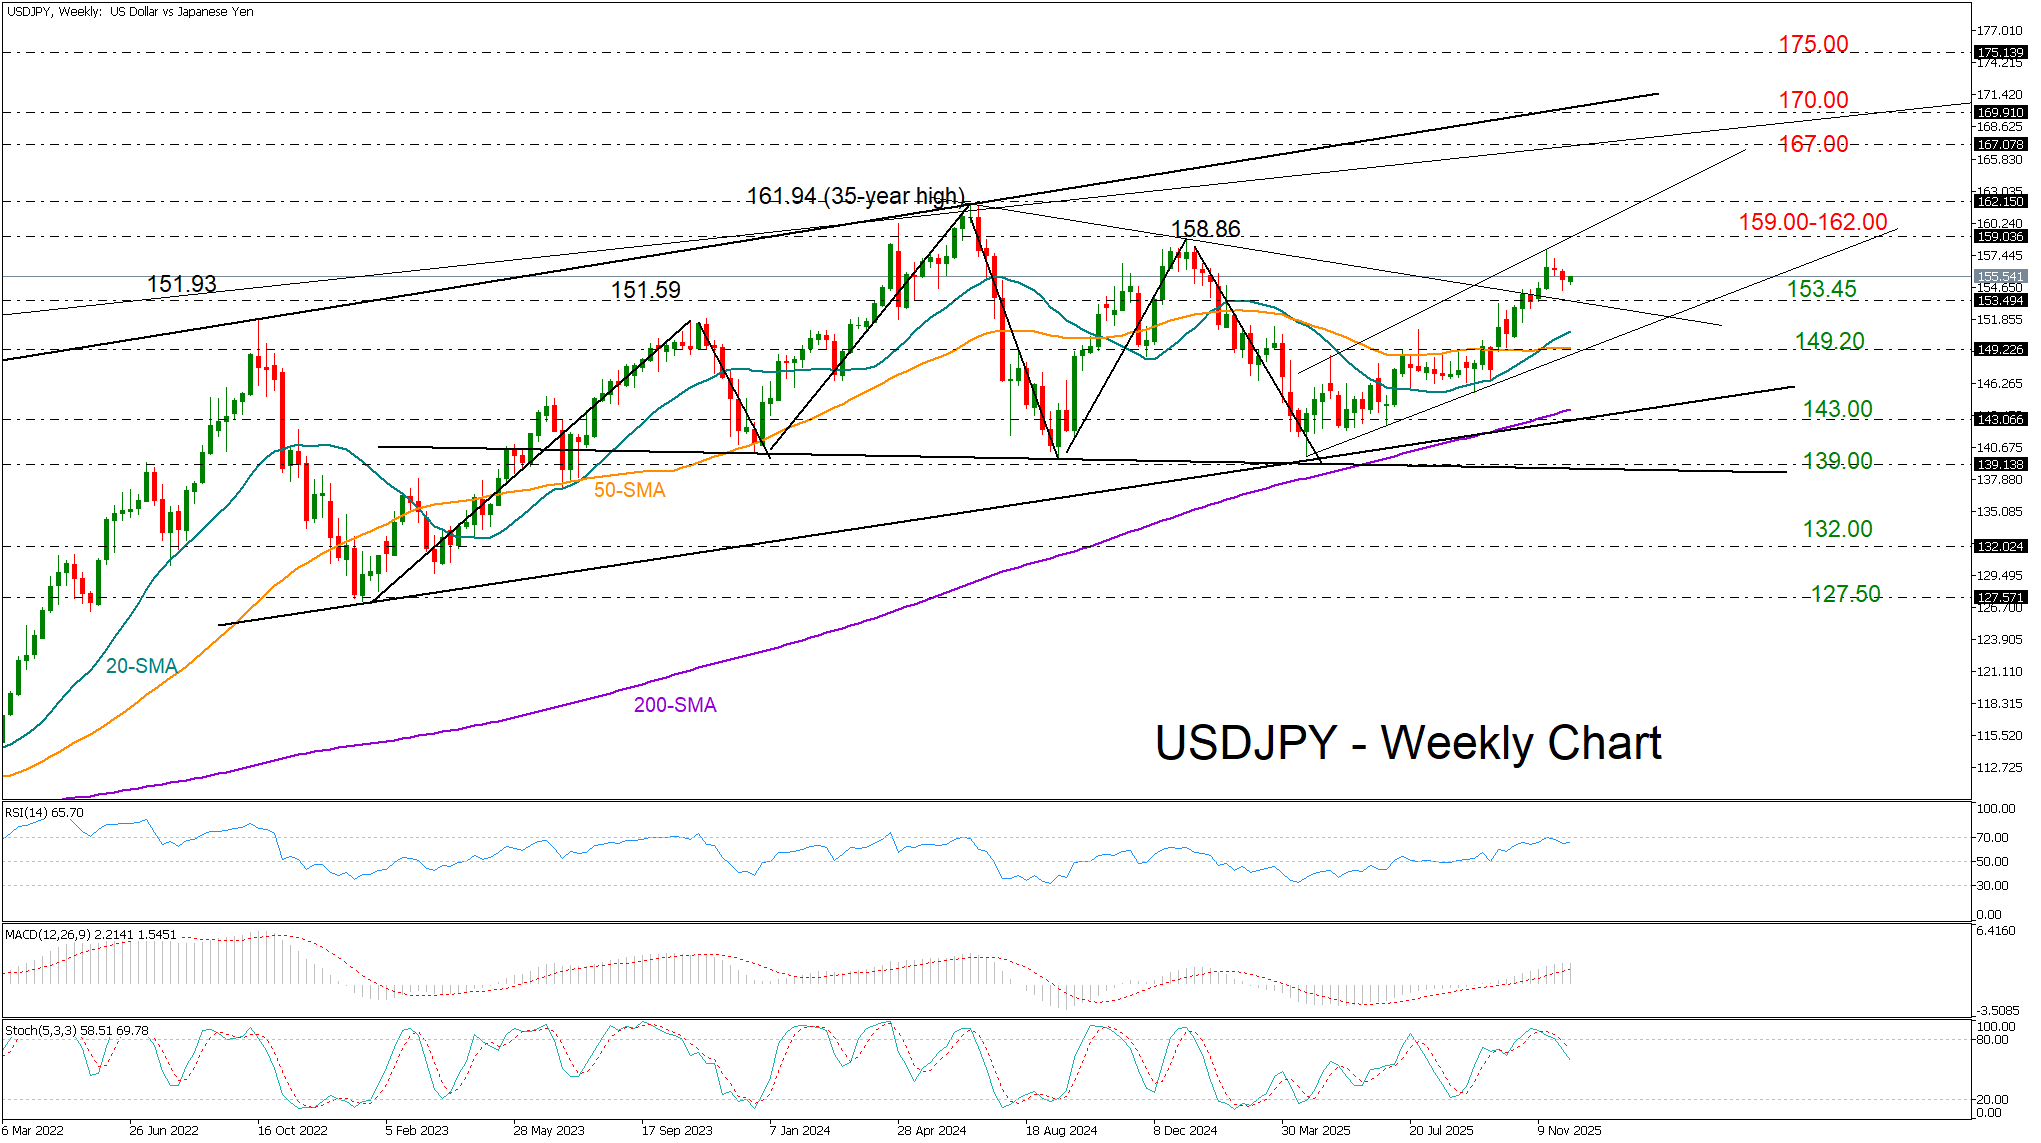
USDJPY reversed sharply in the middle of the year as the Bank of Japan hesitated to raise interest rates, while the Fed kept expectations for additional cuts relatively low. This allowed the pair to recoup yearly losses and approach the January 2025 high of 158.86. Sentiment has since shifted again, with investors now expecting Trump’s Fed chairman nominee to push for more rate reductions as the U.S. labor market weakens, while hopes for rate hikes in Japan have resurfaced despite the new Prime Minister’s dovish stance. The unresolved government-shutdown risk, postponed to January 2026, also threatens to spark fresh volatility, while midterm elections could come center stage in the last quarter of 2026.
Technically, the bearish head-and-shoulders pattern spanning 2023–2025 remains in play, reinforced by the pair’s failure to break above 158.86 in November, where a doji candlestick signaled hesitation. With RSI and stochastic indicators stretched in overbought territory, downside pressure could build.
The bears must drive the price below the 153.45 congestion area and then beneath the key support trendline at 149.20 to challenge the major protective trendline at 143.00. The nearby 200-weekly SMA adds further weight, and a break below it could initially visit the neckline of the head and shoulders pattern seen near 139.00. Any further declines could officially flag a bearish trend reversal, prompting another bearish wave to 132.00.
On the upside, renewed momentum above 159.00-162.00 could open the door for the resistance lines at 167.00 and 170.00 respectively.
Author

Christina joined Trading Point in May 2017. She holds a master degree in Economics and Business from the Erasmus University Rotterdam with a specialization in International economics.


