In this technical blog, we are going to take a look at the past performance of 1 hour Elliott Wave charts of Exxon Mobil ticker symbol: XOM, which we presented to members. But before digging further into the Charts, we need to understand the market nature first. The market is always a fight between the two sides, Buyer and Sellers. We at elliottwave-forecast.com understand the Market Nature and always recommend trading the no-enemy areas.

There are always areas where both sides, Buyers and Sellers agree into a move. We called these no-enemy areas which are reflected as blue box areas on our Charts, which gave us the reaction in favor of market direction in 3 swings at least. Now, let us take a look at the decline from 4/23/2019 peak ( $83.49 ) unfolded in 5 waves impulse structure and ended wave 1 at $75.17 low. Up from there, the stock was expected to fail in 3, 7 or 11 swings within wave 2 bounce for another 5 waves extension lower at least. We will explain the structure below

XOM 1 Hour Elliott Wave Chart From 5/16/2019

XOM

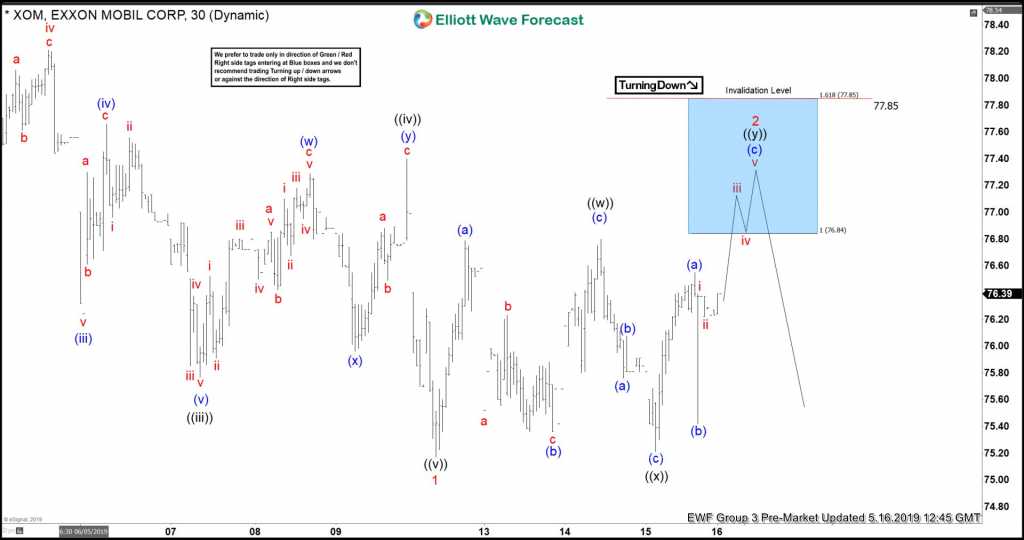
Up from $75.17 low, the bounce in wave 2 unfolded as Elliott wave double three structure where wave ((w)) ended at $76.80. Wave ((x)) pullback ended at $75.21 low. And wave ((y)) was expected to reach our blue box no enemy area at $76.84-77.85 100%-161.8% Fibonacci extension area of ((w))-((x)). From there, the stock was expected to react lower either for more downside or for 3 wave reaction lower at least.

XOM 1 Hour Elliott Wave Chart From 5/19/2019

XOM

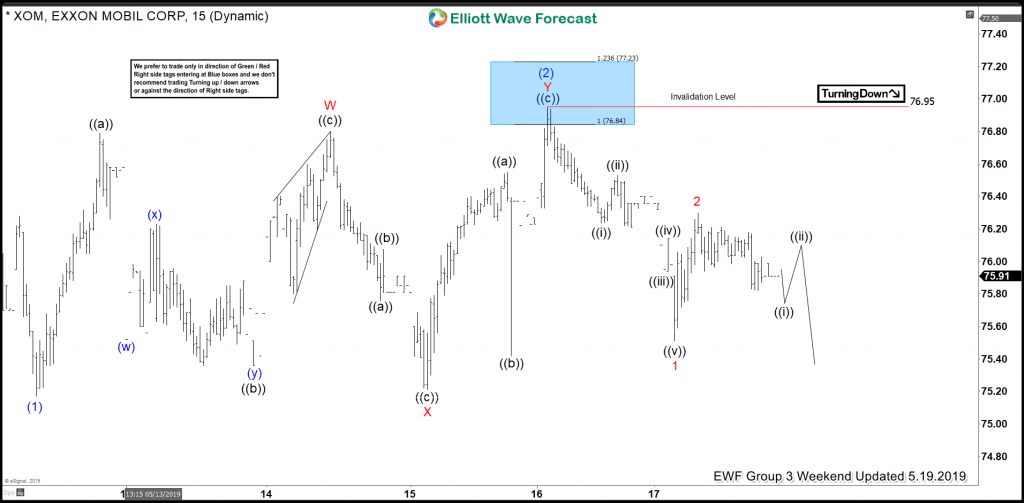
XOM 1 hour Elliott wave Chart from 5/19/2019 weekend update, in which the stock reaches the no enemy area at $76.84-77.85 and reacted lower in favor of turning right side arrow, allowing any shorts to go into risk-free position. The decline from $76.95 unfolded in another lesser degree 5 waves structure, which ensured us that any strength would be temporary & stock should see more downside against that peak. Also, it’s important to note that we switched the degree of labeling into intermediate degree cycles based on our correlation & distribution system.

XOM Latest 1 Hour Elliott Wave Chart From 5/23/2019

XOM

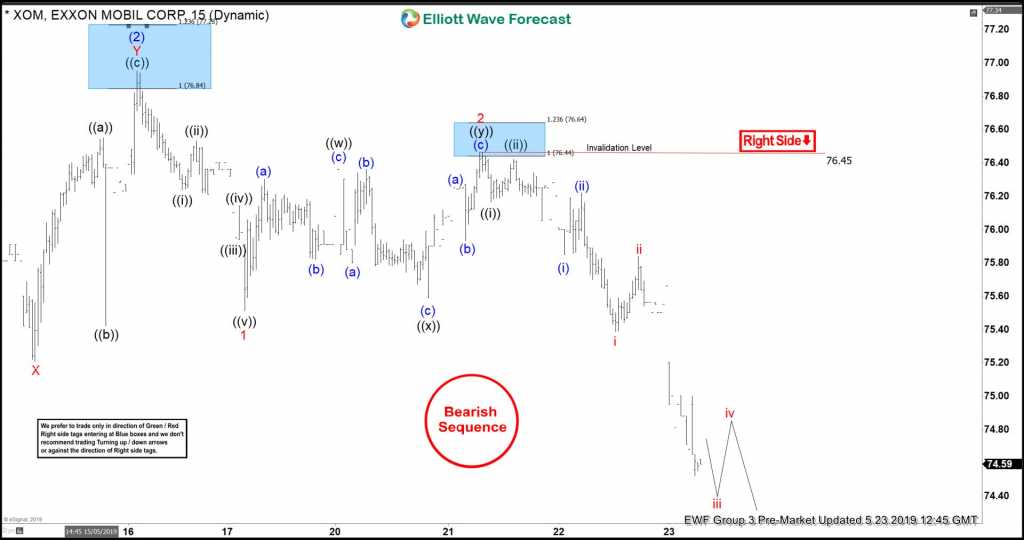
Here’s the latest 1-hour view of XOM from 5/23/2019 Pre-Market update, in which the stock is showing a strong reaction lower as we anticipated by breaking below the $75.17 low. Now looking for more downside, as far as bounces fail below $76.45 high as both right side tag & bearish sequence tag are pointing lower.

If you want to see more real-time analysis & want to trade blue boxes & no enemy areas in XOM & other Stocks n ETF’s then join us with Memorial day promotion now and avail 50% discount on any plan your choice.

Keep in mind that the market is dynamic and the view could change in the meantime. Success in trading requires proper risk and money management as well as an understanding of Elliott Wave theory, cycle analysis, and correlation. We have developed a very good trading strategy that defines the entry. Stop loss and take profit levels with high accuracy and allows you to take a risk-free position, shortly after taking it by protecting your wallet. If you want to learn all about it and become a professional trader.


Become a Successful Trader and Master Elliott Wave like a Pro. Start your Free 14 Day Trial at - Elliott Wave Forecast.

FURTHER DISCLOSURES AND DISCLAIMER CONCERNING RISK, RESPONSIBILITY AND LIABILITY Trading in the Foreign Exchange market is a challenging opportunity where above average returns are available for educated and experienced investors who are willing to take above average risk. However, before deciding to participate in Foreign Exchange (FX) trading, you should carefully consider your investment objectives, level of xperience and risk appetite. Do not invest or trade capital you cannot afford to lose. EME PROCESSING AND CONSULTING, LLC, THEIR REPRESENTATIVES, AND ANYONE WORKING FOR OR WITHIN WWW.ELLIOTTWAVE- FORECAST.COM is not responsible for any loss from any form of distributed advice, signal, analysis, or content. Again, we fully DISCLOSE to the Subscriber base that the Service as a whole, the individual Parties, Representatives, or owners shall not be liable to any and all Subscribers for any losses or damages as a result of any action taken by the Subscriber from any trade idea or signal posted on the website(s) distributed through any form of social-media, email, the website, and/or any other electronic, written, verbal, or future form of communication . All analysis, trading signals, trading recommendations, all charts, communicated interpretations of the wave counts, and all content from any media form produced by www.Elliottwave-forecast.com and/or the Representatives are solely the opinions and best efforts of the respective author(s). In general Forex instruments are highly leveraged, and traders can lose some or all of their initial margin funds. All content provided by www.Elliottwave-forecast.com is expressed in good faith and is intended to help Subscribers succeed in the marketplace, but it is never guaranteed. There is no “holy grail” to trading or forecasting the market and we are wrong sometimes like everyone else. Please understand and accept the risk involved when making any trading and/or investment decision. UNDERSTAND that all the content we provide is protected through copyright of EME PROCESSING AND CONSULTING, LLC. It is illegal to disseminate in any form of communication any part or all of our proprietary information without specific authorization. UNDERSTAND that you also agree to not allow persons that are not PAID SUBSCRIBERS to view any of the content not released publicly. IF YOU ARE FOUND TO BE IN VIOLATION OF THESE RESTRICTIONS you or your firm (as the Subscriber) will be charged fully with no discount for one year subscription to our Premium Plus Plan at $1,799.88 for EACH person or firm who received any of our content illegally through the respected intermediary’s (Subscriber in violation of terms) channel(s) of communication.

Recommended Content


Recommended Content

Editors’ Picks

AUD/USD failed just ahead of the 200-day SMA

AUD/USD failed just ahead of the 200-day SMA

Finally, AUD/USD managed to break above the 0.6500 barrier on Wednesday, extending the weekly recovery, although its advance faltered just ahead of the 0.6530 region, where the key 200-day SMA sits.

AUD/USD News

EUR/USD met some decent resistance above 1.0700

EUR/USD met some decent resistance above 1.0700

EUR/USD remained unable to gather extra upside traction and surpass the 1.0700 hurdle in a convincing fashion on Wednesday, instead giving away part of the weekly gains against the backdrop of a decent bounce in the Dollar.

EUR/USD News

Gold keeps consolidating ahead of US first-tier figures

Gold keeps consolidating ahead of US first-tier figures

Gold finds it difficult to stage a rebound midweek following Monday's sharp decline but manages to hold above $2,300. The benchmark 10-year US Treasury bond yield stays in the green above 4.6% after US data, not allowing the pair to turn north.

Gold News

Bitcoin price could be primed for correction as bearish activity grows near $66K area

Bitcoin price could be primed for correction as bearish activity grows near $66K area

Bitcoin (BTC) price managed to maintain a northbound trajectory after the April 20 halving, despite bold assertions by analysts that the event would be a “sell the news” situation. However, after four days of strength, the tables could be turning as a dark cloud now hovers above BTC price.

Read more

Bank of Japan's predicament: The BOJ is trapped

Bank of Japan's predicament: The BOJ is trapped

In this special edition of TradeGATEHub Live Trading, we're joined by guest speaker Tavi @TaviCosta, who shares his insights on the Bank of Japan's current predicament, stating, 'The BOJ is Trapped.' 

Read more

Majors

Cryptocurrencies

Signatures