|

Xom Elliott Wave view: Forecasting decline lower

In this technical blog, we are going to take a look at the past performance of 1 hour Elliott Wave Charts of the Exxon Mobil ticker symbol: XOM. In which, the decline from 08 June 2020 peak unfolded as an impulse 5 wave structure. Thus suggested that it's a continuation pattern. And as per Elliott wave theory after a 3 waves pullback, it should do another extension higher in 5 waves impulse structure at least. Therefore, we advised members not to buy the instrument & trade the no enemy areas (blue boxes) as per the Elliott wave hedging tool. Looking for 3 wave reaction lower at least. We will explain the structure & forecast below:

XOM 1 Hour Elliott Wave Chart

XOM

XOM 1 Hour Elliott Wave Chart from 6/16/2020 Pre-Market update. In which, the bounce to $56.39 high ended a cycle from March 2020 lows. Down from there, the decline unfolded as 5 waves impulse structure where wave (1) ended at $50.60 low. Wave (2) ended at $52.16 high, wave (3) ended at $46.93 low, wave (4) ended at $48.84 high, and wave (5) ended at $46.05 low. Above from there, the stock made a 3 wave bounce to correct the cycle from $56.39 high. The internals of that bounce unfolded as an Elliott Wave Flat structure where wave (A) ended at $48.62 high. Wave (B) ended at $44.75 and wave (C) was expected to reach $49.59- $51.45 100%-161.8% Fibonacci extension area of (A)-(B). From where sellers were expected to appear in the stock looking for another 5 waves lower or for 3 wave reaction lower at least.

XOM 1 Hour Elliott Wave Chart
XOM

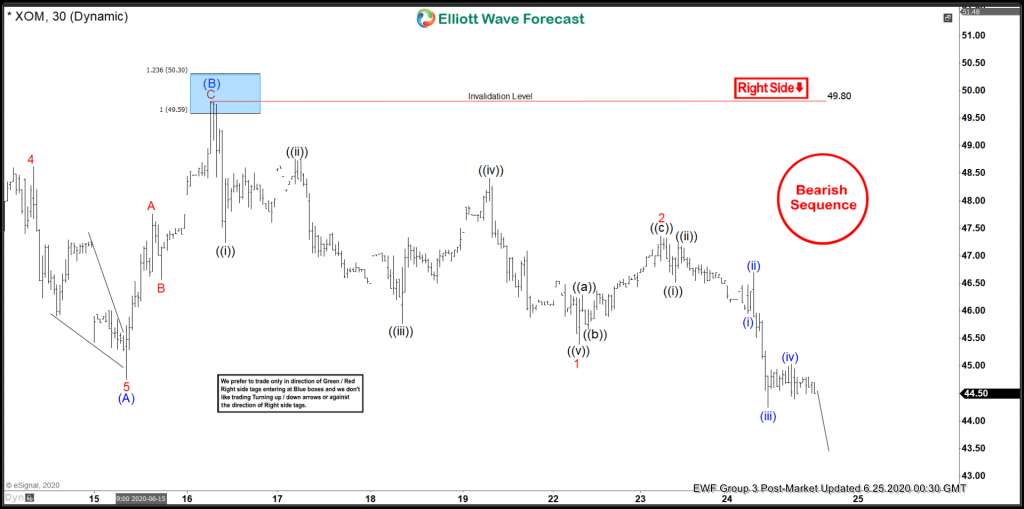
Here's 1 Hour Elliott Wave Chart from 6/25/2020 Post-Market update. In which, the stock is showing strong reaction lower taking place from the blue box area. Allowed members to create a risk-free position shortly after taking the shorts at $49.59- $51.45 blue box area. It's important to note that with further market data, we re-adjusted the count by downgrading the degree of labeling in 1 Hour Charts.

Author

Elliott Wave Forecast Team

Elliott Wave Forecast Team

ElliottWave-Forecast.com

More from Elliott Wave Forecast Team
Share:

Editor's Picks

GBP/USD holds range near 1.3500 after UK Q2 GDP beat

GBP/USD keeps its range near the 1.3500 psychological mark in the European session on Thursday. The UK GDP data beat estimates across the time horizon but failed to inspire the British Pound. Meanwhile, the US Dollar stabilizes after the US CPI data-led sell-off, checking any upside attempts in the pair.

EUR/USD flatlines above 1.1500 as US Dollar stablizes ahead of PPI

EUR/USD is trading modestly flat above 1.1500 in European trading hours on Thursday. The pair stalls its rebound as the US Dollar consolidates losses incurred after the release of July's Consumer Price Index report. Inflation in the US moderated across a broad range of goods and services, cooling expectations for an aggressive Federal Reserve rate hike in September and weighing on the Greenback. The US PPI data is next in focus.

Gold weakens further below $4,400 as USD sticks to gains amid Fed bets, Iran tensions

Gold extends its intraday retracement slide from the highest level since June 5, around the $4,450 area touched earlier this Thursday, and slides further below the $4,400 mark heading into the European session. The initial market reaction to signs of moderating US inflation fades quickly as investors remain worried that higher energy prices will rekindle inflationary pressures.

XRP holds at make-or-break level, ADA and SOL risk 50-day EMA breakout

Top altcoins, including Ripple, Cardano, and Solana, are facing downside pressure, holding at crucial support levels. The technical outlook for XRP, ADA, and SOL indicates a mild bearish bias as downside pressure mounts.

Gold has priced a Fed pause. The hike is still coming
July inflation landed exactly where the consensus had it, on all four lines of the release, and Gold responded by adding around 1% and holding fast near $4,400/ounce, trading at its highest since early June. A print that surprises nobody is not supposed to move a metal that far.
Why is Crude Oil priced for a reopening the ships haven't made?
Fourteen vessels crossed the Strait of Hormuz on Tuesday. Before the war, the count ran near 120 a day. In the sessions since the waterway was publicly declared open, Brent has drifted back to $87 and West Texas Intermediate (WTI) to $81, both a little lower again on Wednesday, with daily momentum on each unwound from the top of its range in late July to the low twenties now.















