XLP Buying The Elliott Wave Dips At Blue Box Areas

In this technical blog, we are going to take a look at the past performance of 1 hour Elliott Wave Charts of XLP a consumer staple ETF from the USA, which we presented to members at elliottwave-forecast.com. In which, the rally from December 2018 lows, showed the higher high sequence in higher time frame charts favored more strength. Also, the right side tag pointed higher against $55.52 low seen on 5/31/2019 low called for more upside. We will explain the structure & forecast below:
XLP 1 Hour Elliott Wave Chart From 6/16/2019
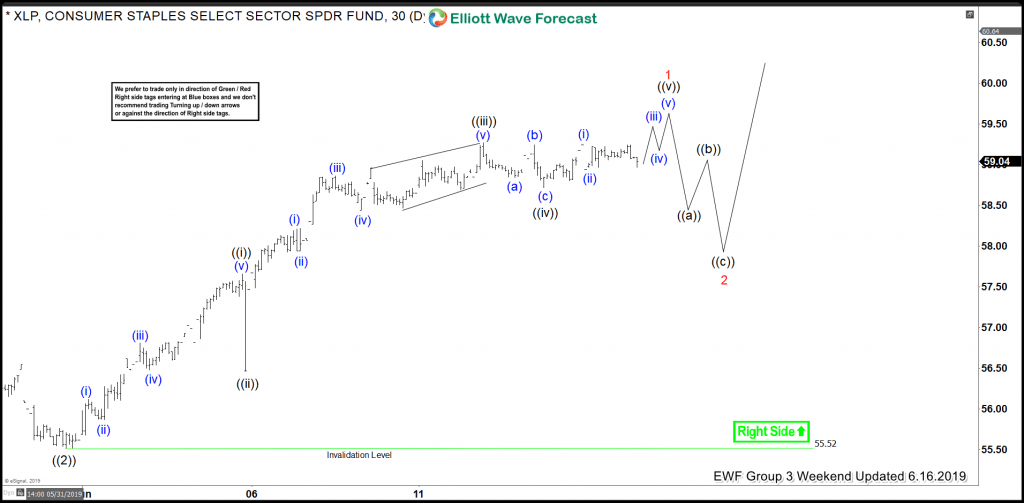
XLP 1 hour Elliott Wave Chart From 6/16/2019 weekend update, in which the rally from $55.52 low unfolded as impulse structure within wave 1 looking to extend higher 1 more time. Afterwards, the ETF was expected to see a wave 2 pullback in 3, 7 or 11 swings to correct the short term rally from $55.52 low before resuming higher again. Therefore, we advised our members not to sell it in a proposed pullback & keep looking to buy the wave 2 dips in 3, 7 or 11 swings at the extreme blue box areas.
XLP 1 Hour Elliott Wave Chart From 6/30/2019
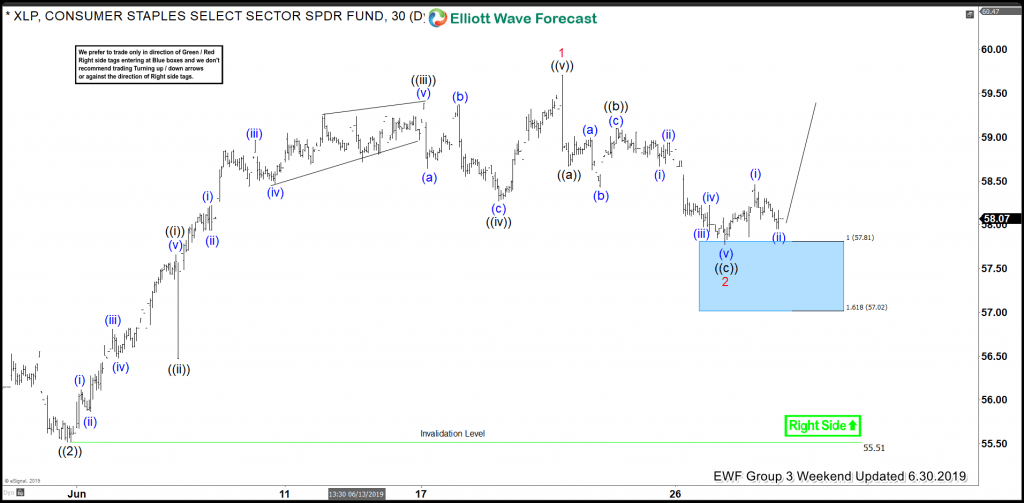
XLP 1 hour Elliott Wave Chart from 6/30/2019 weekend update, in which the ETF ended the 5 waves rally within wave 1 at $59.71 high. Down from there, the pullback in wave 2 took place in 3 swings as zigzag structure, which managed to reach $57.81-$57.02 100%-161.8% Fibonacci extension area of ((a))-((b)). Thus provided buying opportunity to our members at the blue box area looking for the next extension higher or for 3 wave reaction higher at least.
XLP 1 Hour Elliott Wave Chart From 7/07/2019
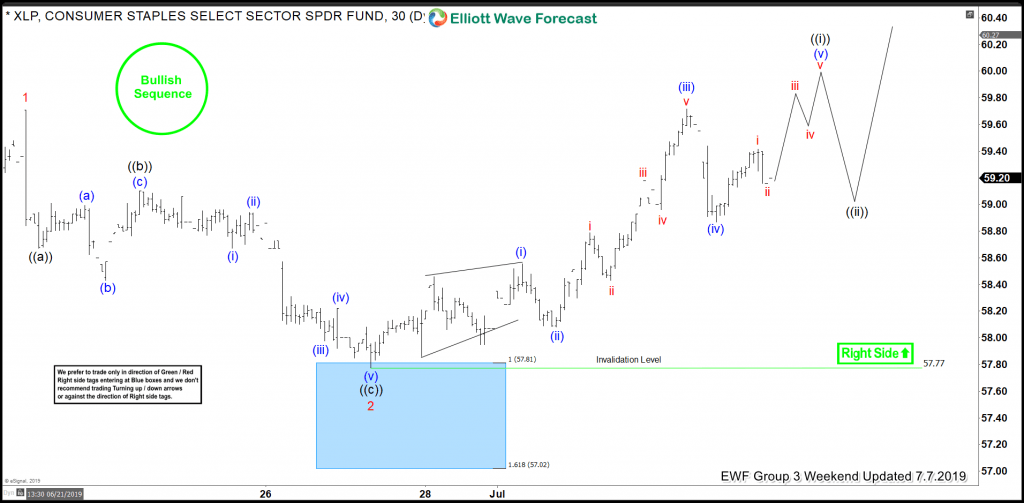
Here’s 1 Hour Elliott Wave Chart from 7/07/2019 Weekend update, in which the ETF is showing reaction higher taking place from the blue box area. And shortly after taking the trade the ETF bounced strongly & managed to make a new high above the previous wave 1 peak ($59.71) confirming the next extension in wave 3 higher. Also, with this rally higher the ETF allowed our members to create a risk-free position in the trade. Now, as far as dips remain above $57.77 low the ETF should extend higher.
Interested in active FX or CRYPTO Elliott Wave labeled charts on a daily basis? Now it's your time; we have a SPECIAL offer; 50% Off on FX and Crypto markets. Check Elliott Wave Forecast website for more details.
Author

Elliott Wave Forecast Team
ElliottWave-Forecast.com


