XAU/USD bullish bounce within triangle chart pattern

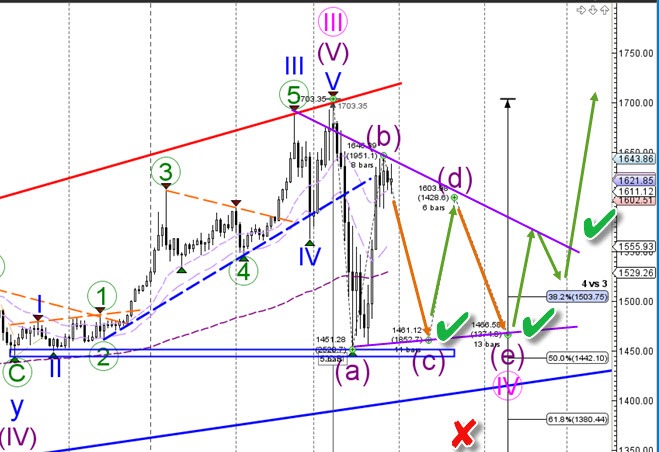
XAU/USD (Gold) made a strong bullish bounce up at the support zone (blue). But the wave patterns, however, suggest a longer correction zone via an ABCDE (purple) triangle.
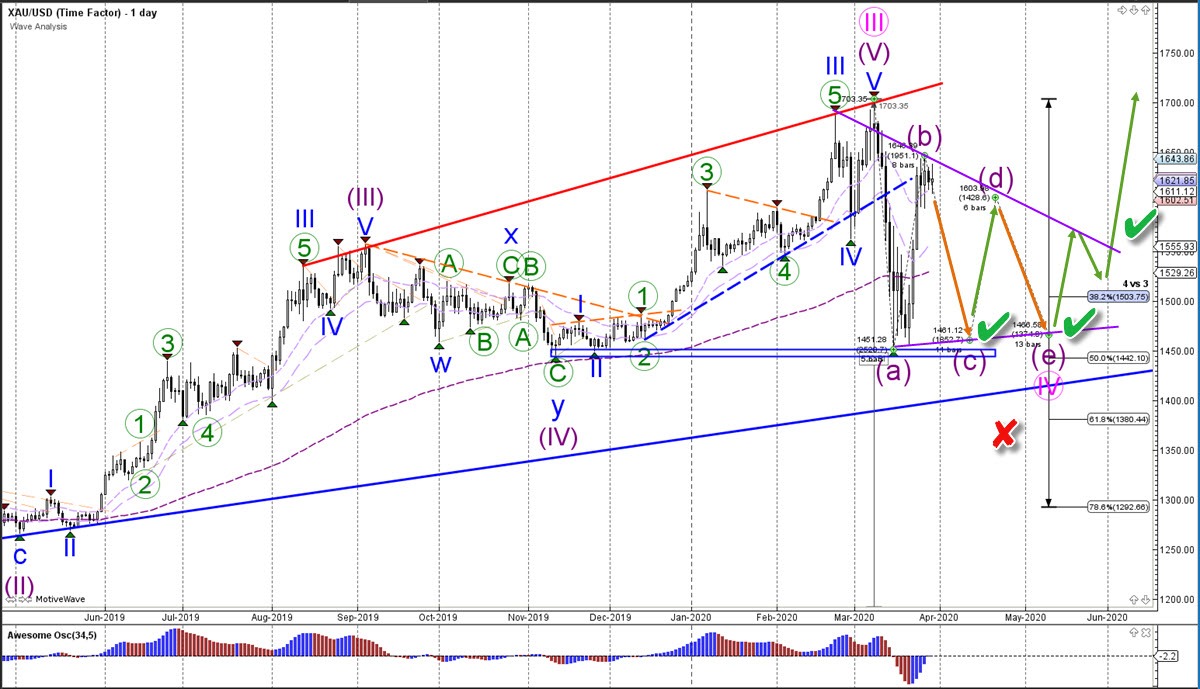
Daily chart
The XAU/USD remains in an uptrend as long as price stays above the 50% Fibonacci level of wave 4 vs 3 and the support trend line (blue). A bearish bounce and swing could confirm the wave C (purple) of the larger ABCDE (purple). A bullish bounce and breakout (green checks) is needed to confirm the uptrend continuation of the Gold bull run. Next target is around the $1,700-$1,750 zone.
The analysis has been done with the CAMMACD.Core System.
For more daily technical and wave analysis and updates, sign-up up to our ecs.LIVE channel.
Author

Chris Svorcik
Elite CurrenSea
Experience Chris Svorcik has co-founded Elite CurrenSea in 2014 together with Nenad Kerkez, aka Tarantula FX. Chris is a technical analyst, wave analyst, trader, writer, educator, webinar speaker, and seminar speaker of the financial markets.


