WTI

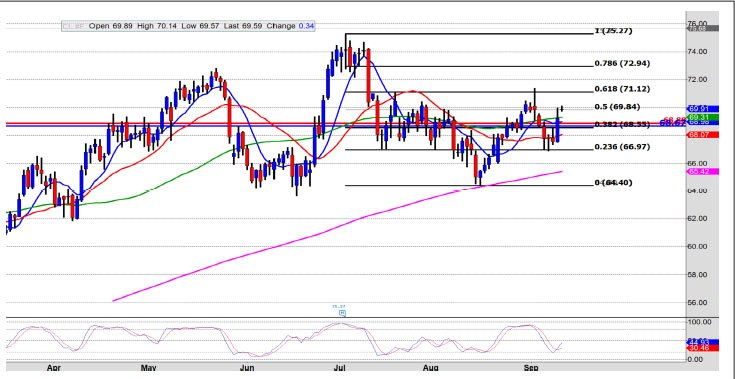
Well WTI was on a roll yesterday slicing through both the daily and weekly pivot without too much trouble....Now we have been higher on the 4th Sept when we overshot that 61.8 Fib and went to 71.40...now you can see that the weekly and daily pivot are nopt that far apart 6867 weekly...daily 6891...also intersecting with the 38.2 of 6855....currently trading around 69.57 we have the 55 day M/A at 69.31...s and the 9 day at 68.98....so as long as we can stay trading above all these 4 levels...we should today till Friday be in bid mode...

Now don't get me wrong...there is every chance that we can come down and retest the daily and weekly pivots but unless we bust 6800 just to get the 21 day out of the way @ 68.07 the market will continue to rise...Look at the technical indicators...the stochastics are bullish... it is only the daily RSI and ROC that are still showing negative....but as I say ...stochastics are leading indicators not lagging ones...so I will stick with the stochastics...unless 6800 is broken....

If we do break 6800 we would be looking at 66.97 as a viable target that doesn't tie in with any Pivot points on the weeklies or dailies... but on the pullback from 64.40 to 71.40 we held this level really well....so there is no reason why we could not do that again...

Now lets say we do not trade down to out weekly/daily pivots and stay above 69.31 ish...there is scope once more to trade higher and we would then be looking at the market coming up to the recent Sept high of 71.40...Yes we did reject that level once ...but it is the 61.8 fib and as I have said...these are important fibs....A break however above 71.40 and sustained on a close basis would take WTI upto 72.95/73.00 quite quickly....

WTI

The research provided by Charmer Charts is provided solely to enable clients to make their own investment decisions and does not constitute personal investment recommendations. No recommendations are made directly or indirectly by Technicalanalysisreports.com or Charmer Charts as to the merits or suitability of any investment decision or transaction that may result directly or indirectly from having viewed the technical analysis investment research. Customers are therefore urged to seek independent financial advice if they are in any doubt. The value of investments and the income derived from them can go down as well as up, and you may not get back the full amount you originally invested. Derivatives and foreign exchange trading are particularly high-risk, high-reward investment instruments and an investor may lose some or all of his or her original investment. Also, if you decide to acquire any investment denominated in a different currency you should note that changes in foreign exchange rates may have an adverse effect on the value, price and income of the investment in your own currency. Technicalanalysisreports.com or Charmer Charts shall not be liable for any direct or indirect, incidental or consequential loss or damage (including loss of profits, revenue or goodwill) arising from the use, inability to use, interruption or non-availability of the technical analysis investment research or any part of the research materials published or otherwise any loss of data on transmission, howsoever caused. Whilst the research material published is believed to be reliable and accurate, it is not independently verified. Accordingly, no representation or warranty is made or given by Technicalanalysisreports.com or Charmer Charts, its officers, agents or employees as to the accuracy or completeness of the same and no such person shall have liability for any inaccuracy in, or omission from, such materials.

Recommended Content


Recommended Content

Editors’ Picks

EUR/USD edges lower toward 1.0700 post-US PCE

EUR/USD edges lower toward 1.0700 post-US PCE

EUR/USD stays under modest bearish pressure but manages to hold above 1.0700 in the American session on Friday. The US Dollar (USD) gathers strength against its rivals after the stronger-than-forecast PCE inflation data, not allowing the pair to gain traction.

EUR/USD News

GBP/USD retreats to 1.2500 on renewed USD strength

GBP/USD retreats to 1.2500 on renewed USD strength

GBP/USD lost its traction and turned negative on the day near 1.2500. Following the stronger-than-expected PCE inflation readings from the US, the USD stays resilient and makes it difficult for the pair to gather recovery momentum.

GBP/USD News

Gold struggles to hold above $2,350 following US inflation

Gold struggles to hold above $2,350 following US inflation

Gold turned south and declined toward $2,340, erasing a large portion of its daily gains, as the USD benefited from PCE inflation data. The benchmark 10-year US yield, however, stays in negative territory and helps XAU/USD limit its losses. 

Gold News

Bitcoin Weekly Forecast: BTC’s next breakout could propel it to $80,000 Premium

Bitcoin Weekly Forecast: BTC’s next breakout could propel it to $80,000

Bitcoin’s recent price consolidation could be nearing its end as technical indicators and on-chain metrics suggest a potential upward breakout. However, this move would not be straightforward and could punish impatient investors. 

Read more

Week ahead – Hawkish risk as Fed and NFP on tap, Eurozone data eyed too

Week ahead – Hawkish risk as Fed and NFP on tap, Eurozone data eyed too

Fed meets on Wednesday as US inflation stays elevated. Will Friday’s jobs report bring relief or more angst for the markets? Eurozone flash GDP and CPI numbers in focus for the Euro.

Read more

Majors

Cryptocurrencies

Signatures