WTI moves into mark-up phase

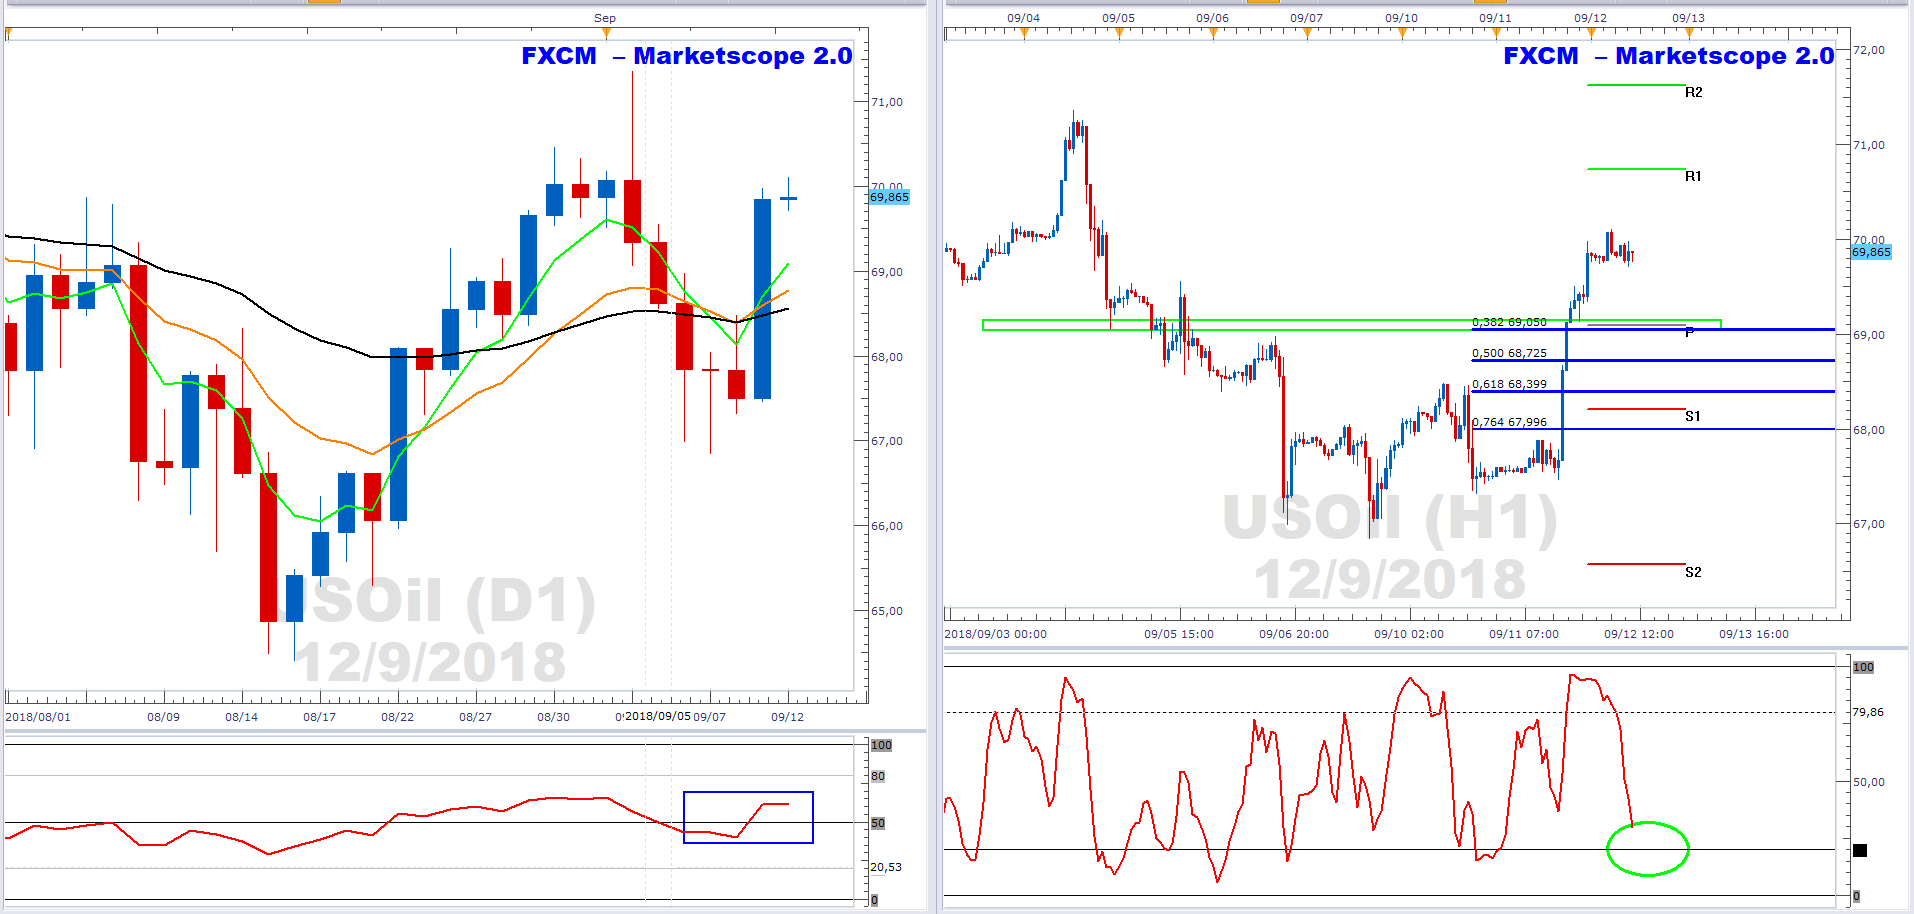
The left chart shows daily price action. USOil is in a mark-up phase. This phase is typically defined by a bullish EMA formation. The green 5-day EMA > the orange 13-day EMA > the black 34-day EMA. The RSI(9) is above 50 and indicative of bullish momentum (blue rectangle).
The right chart shows hourly price action. Key support is potentially at the confluence of factors including the central pivot level (P), the 38.2% Fibonacci retracement level and price congestion support (green rectangle). The stochastic also needs to move to more buyer friendly levels (green ellipse).
A pullback in USOil may provide a “buy the dip in an uptrend” opportunity. Please be award of the inventory release at 4:30pm, which is likely to increase volatility.
Author

Russell Shor (MSTA, CFTe, MFTA) has an Honours Degree in Economics from the University of South Africa and holds the coveted Certified Financial Technician and Master of Financial Technical Analysis qualifications from the Interna


