Why Is the Weakness In GBPUSD Likely?
In recent days, the British pound declined quite sharply against the greenback, which caused several negative developments. Will currency bears be strong enough to trigger further deterioration in the coming week?
EUR/USD – Double Bottom or Further Declines?
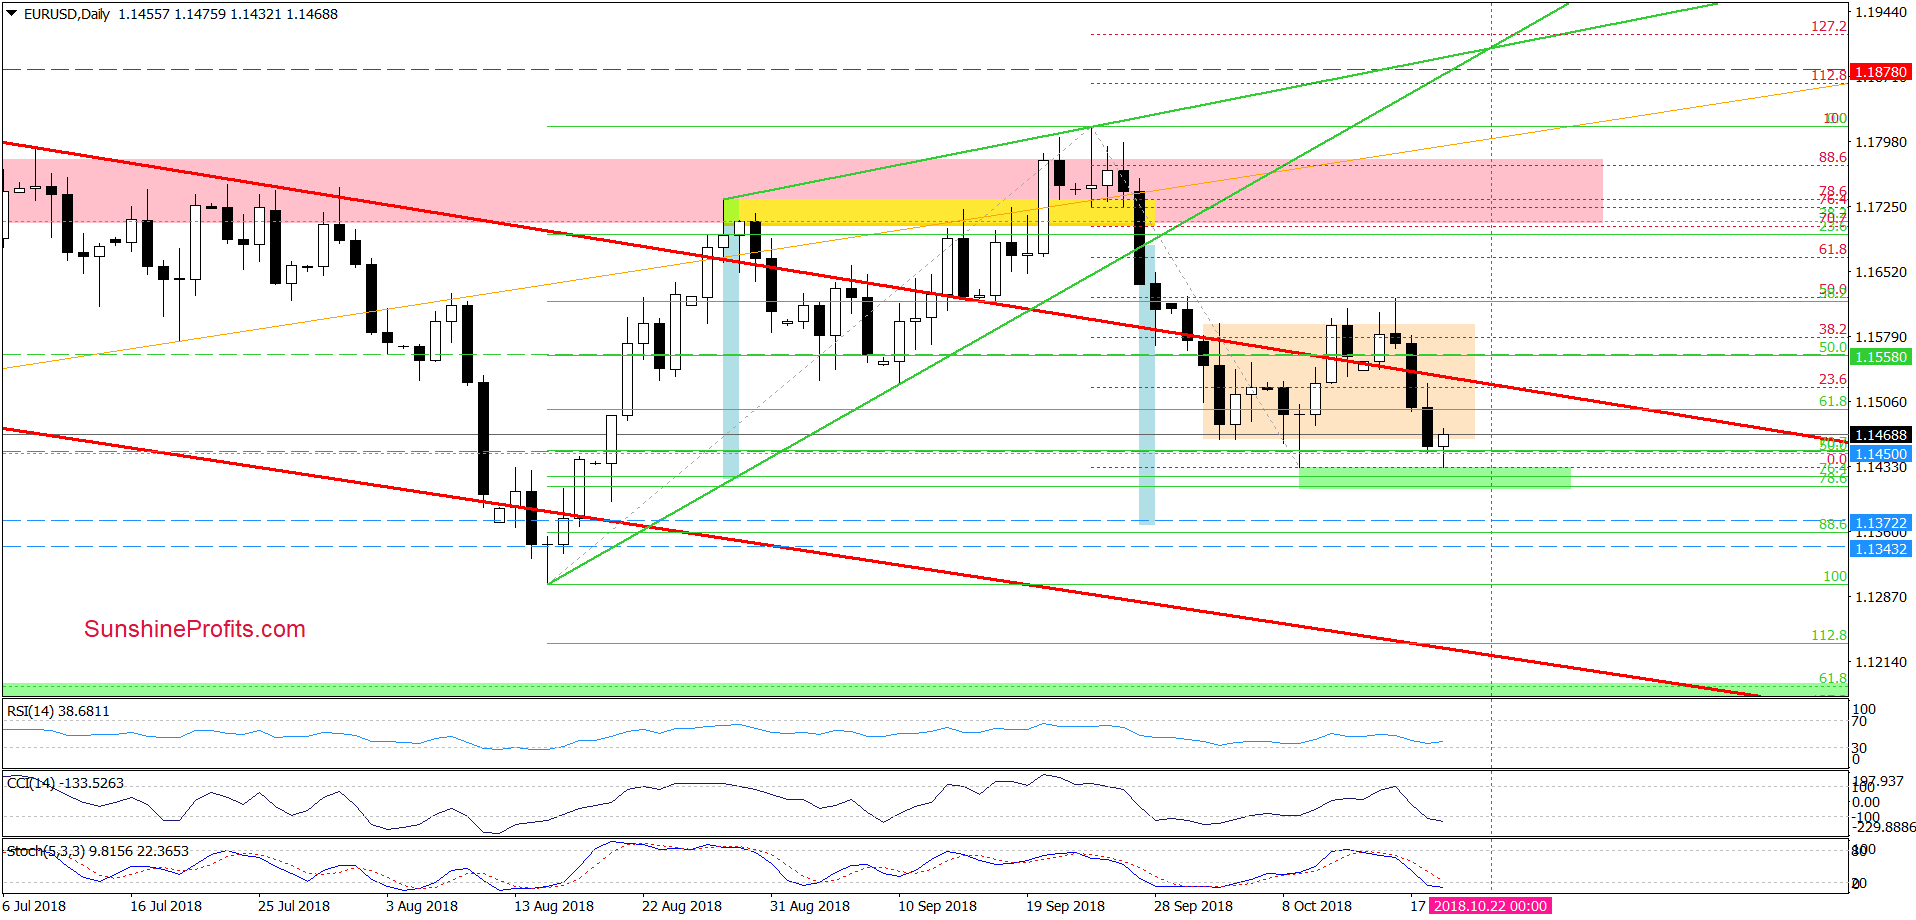
On Wednesday, EUR/USD closed the day well below the red line (the upper border of the red declining trend channel). Yesterday, we noticed a small rebound, which looked like a nothing more than a verification of the earlier breakdown.
Additionally, the sell signals generated by the indicators were in play, supporting another move to the downside. Therefore, we wrote in our yesterday’s alert that “(…) if the pair declines from this area, we’ll see a test of the lower border of the consolidation or even the last week’s low in the following days.”
Looking at the daily chart, we see that currency bears took EUR/USD lower (as we had expected), which resulted in a daily closure under the lower line of the consolidation. Earlier today, the pair moved even lower and re-tested the last week’s low and the green support zone, making our short position more profitable (as a reminder, we opened it when EUR/USD was trading at around 1.1558).
Despite this deterioration, the combination of supports encouraged currency bulls to act, which caused a small rebound and a comeback to the lower line of the consolidation. Such price action looks like a verification of the earlier breakdown, which in combination with the sell signals generated by the daily indicators suggests that another attempt to move lower is just around the corner.
Therefore, if the exchange rate extends losses from current levels, we’ll see a drop to (at least) 1.1372, where the size of the downward move will correspond to the height of the green rising wedge.
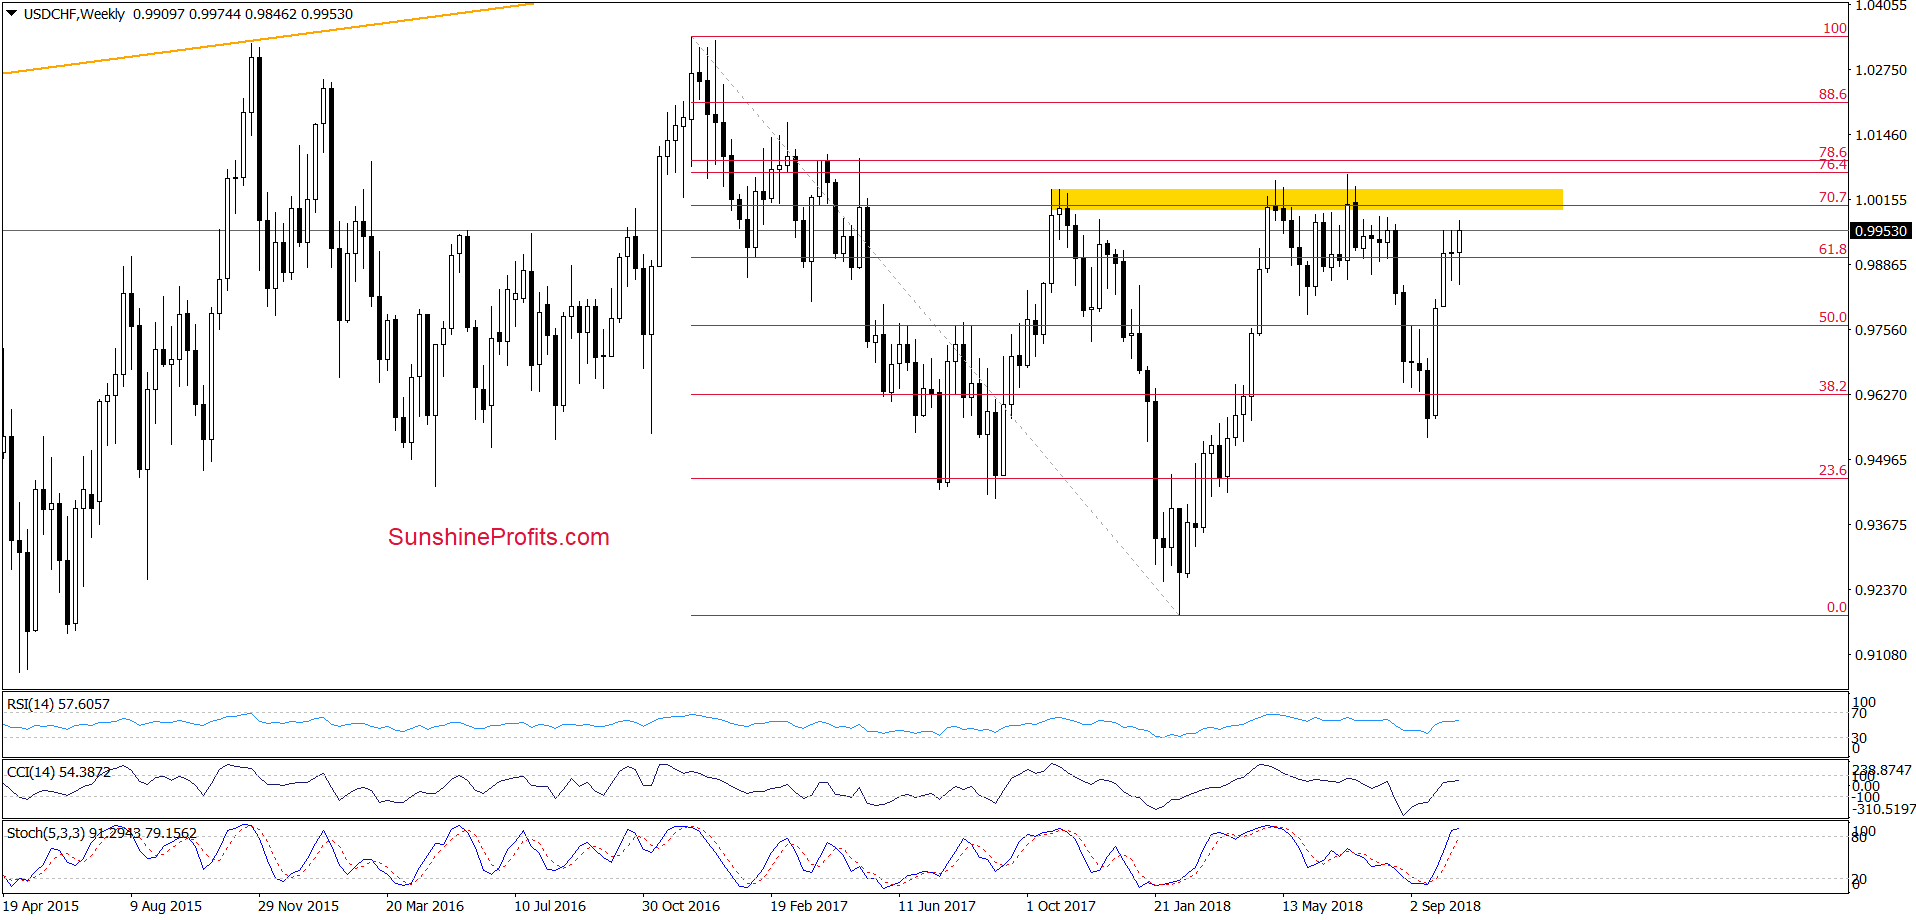
GBP/USD – Breakdown and Its Consequences
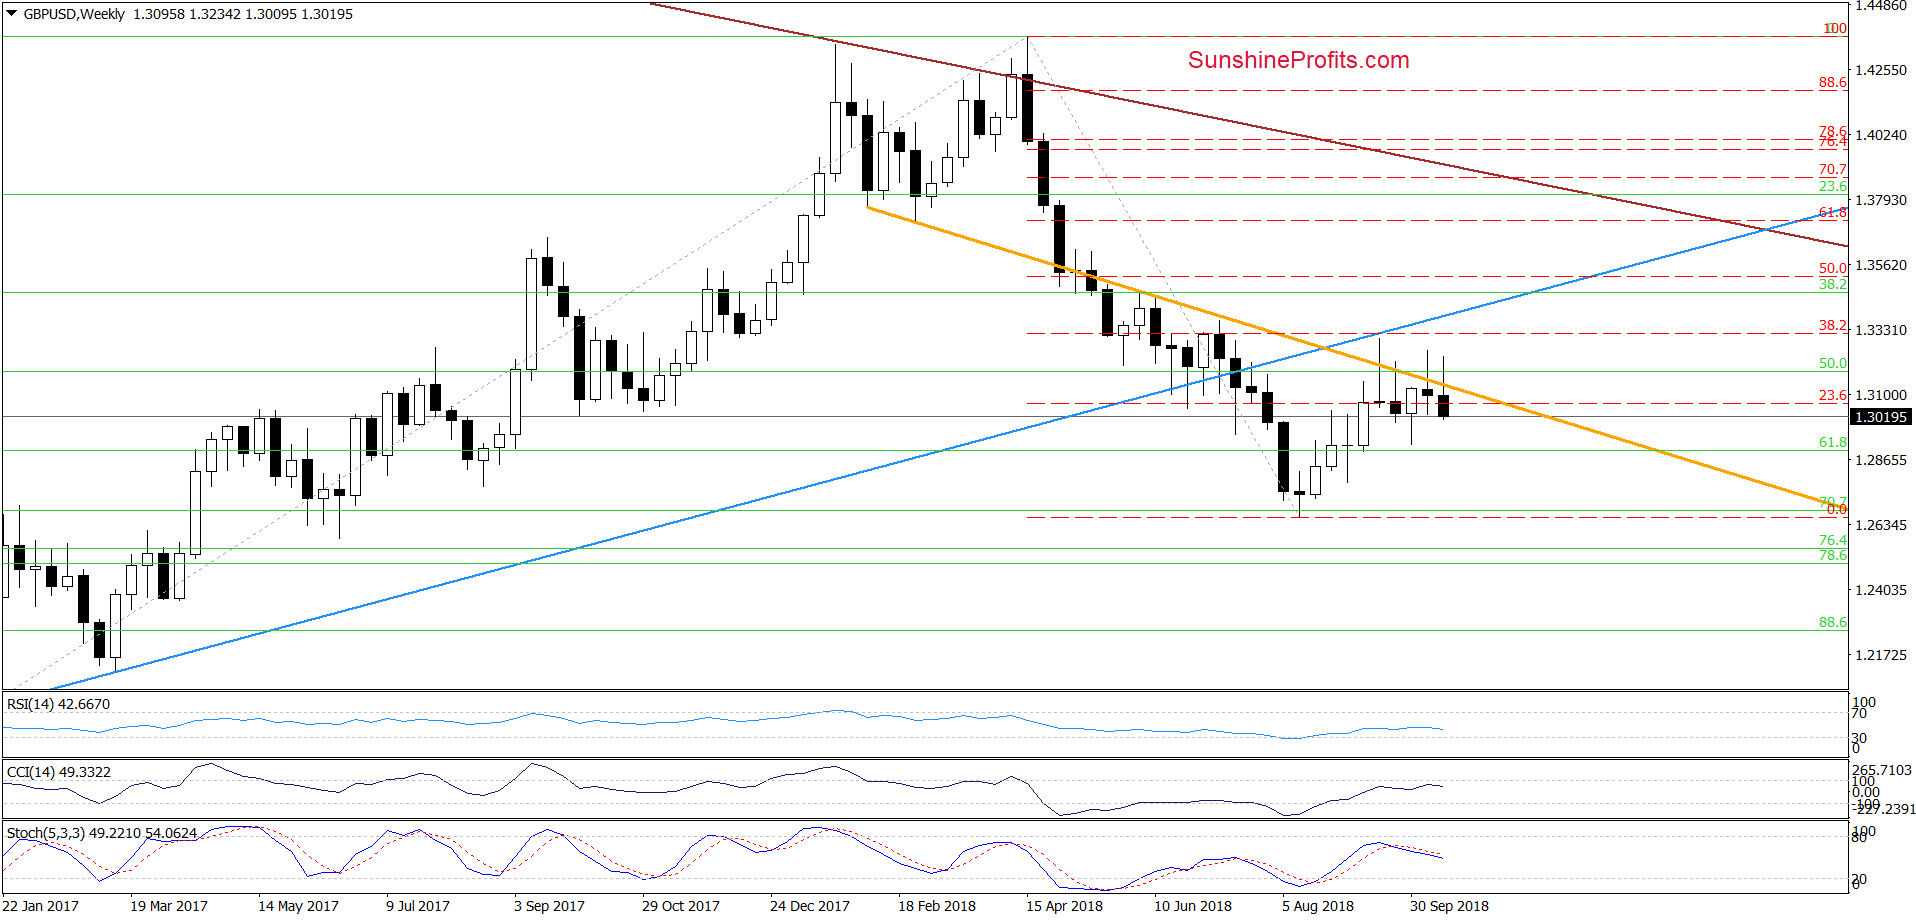
The first thing that catches the eye on the weekly chart is another invalidation of the earlier small breakout above the orange line. As you see, currency bulls have quite big problems with this resistance for many weeks, which increases its importance for the future of this currency pair.
In other words, we believe that as long as there is no successful breakout above it lower values of GBP/USD are more likely than another upswing. This scenario is also reinforced by the sell signal generated by the Stochastic Oscillator and the short-term picture of the exchange rate.
Why? Let’s take a look at the daily chart below.
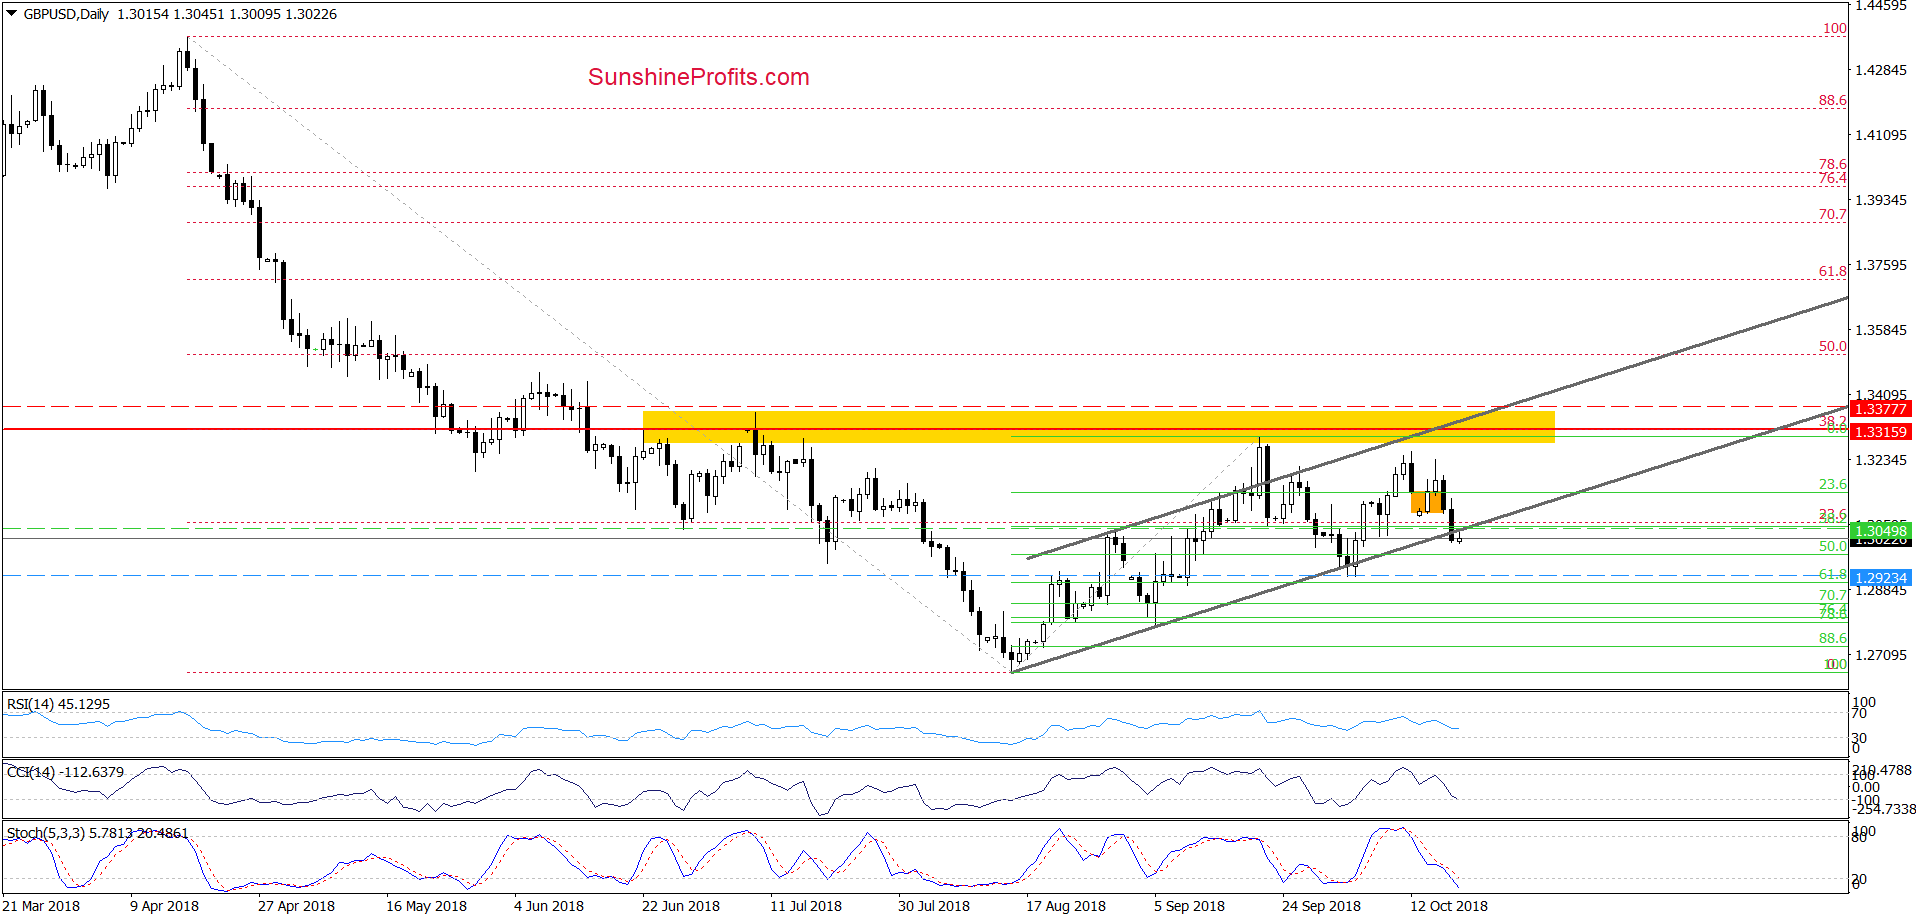
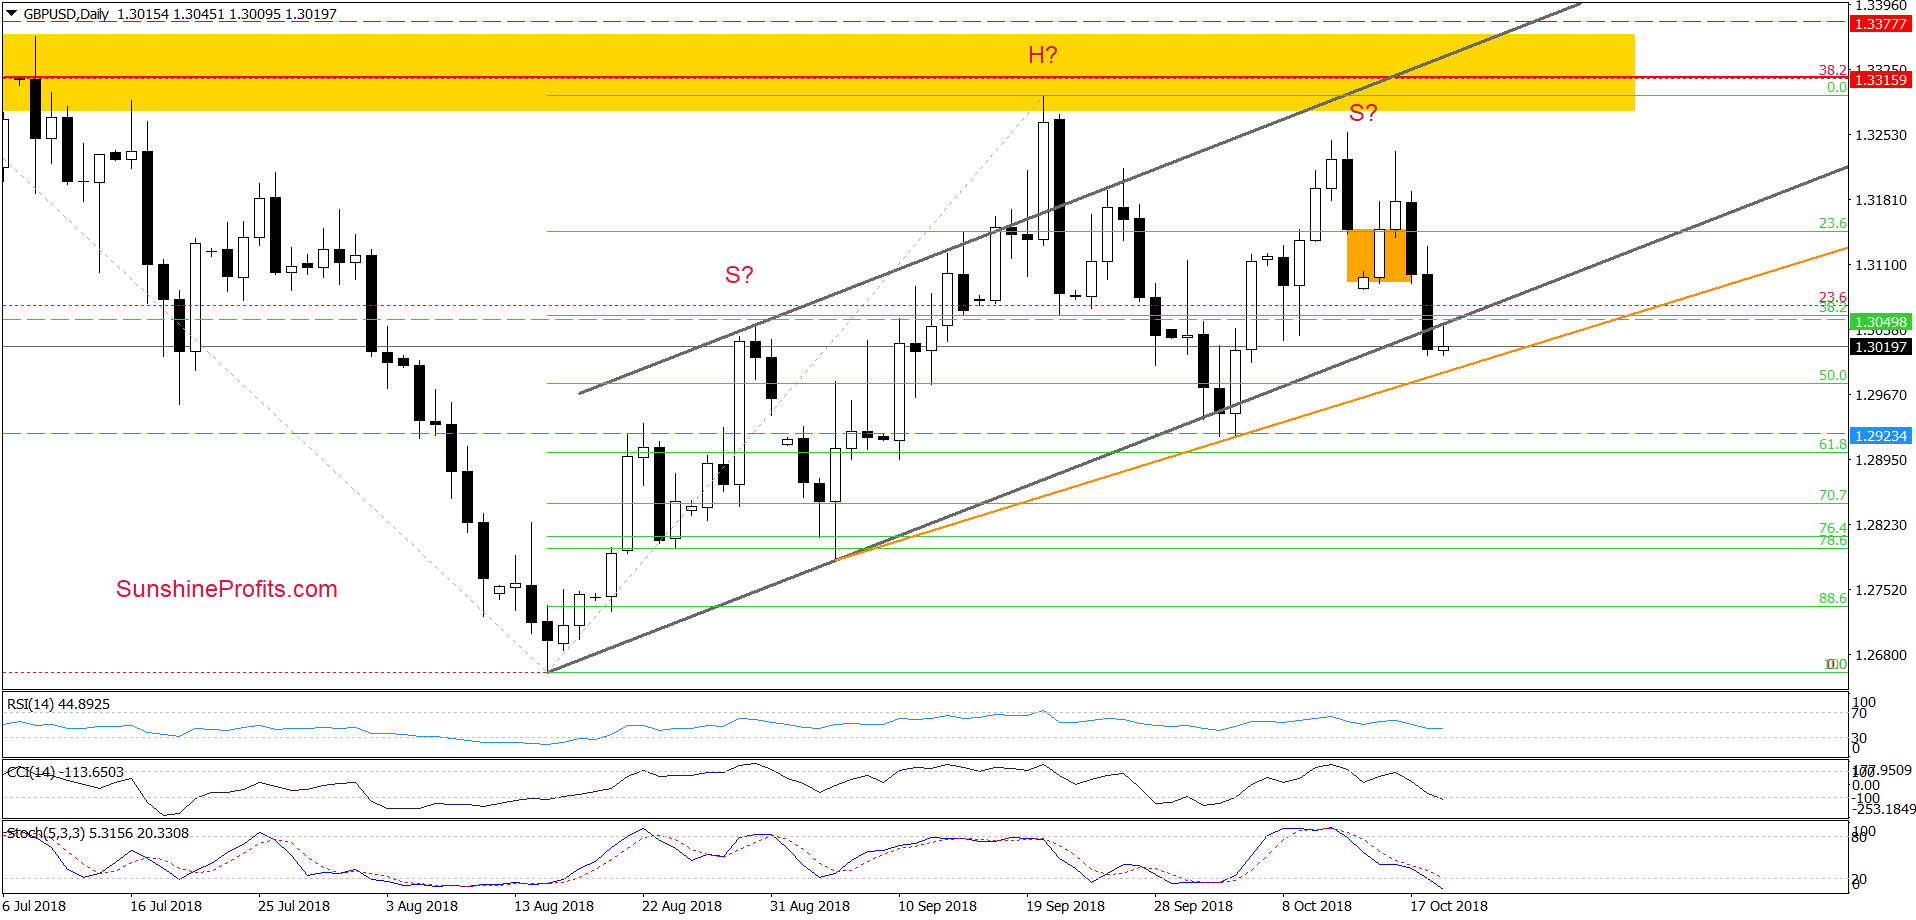
From this perspective, we see that GBP/USD declined quite sharply in recent days (making our short positions profitable), which resulted in a drop a daily closure under the lower border of the grey rising trend channel.
Earlier today, we noticed a small rebound, but just like in the case of EUR/USD it looks like a verification of yesterday’s breakdown and suggests further deterioration in the following days – especially when we factor in the sell signals generated by the indicators and the above-mentioned medium-term picture of the exchange rate.
How low could GBP/USD go at the beginning of the coming week?
In our opinion, currency bulls will test the orange support line based on the early-September and early-October lows. Why this line? Because, when we take a closer look at the chart, we can see a potential head and shoulders formation and read the last downswings as shaping the right arm of the pattern.
If this is the case, and the sellers manage to push the pair under this line, the way to lower values of GBP/USD will be open and we’ll see (at least) a test of the early-October lows during the following sessions.
USD/CHF vs. Important Resistances
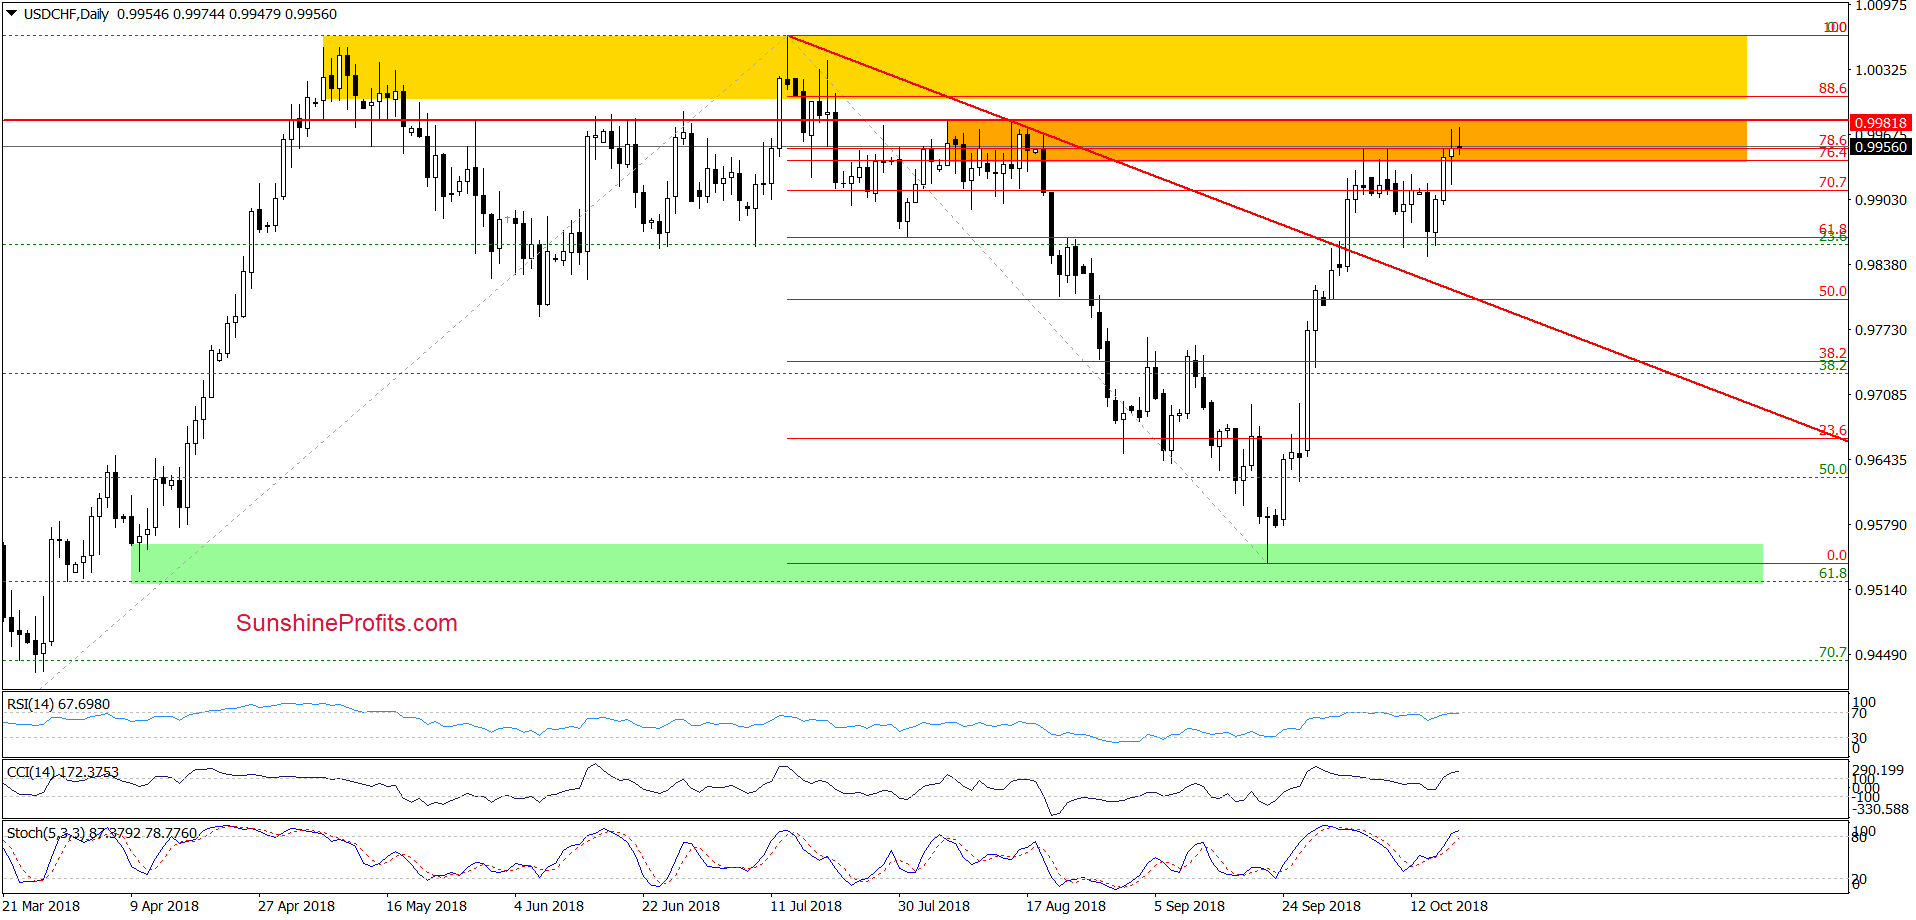
From today’s point of view, we see that although USD/CHF bounced off the recent lows once again and hit a fresh October peak, the exchange rate is still trading inside the orange resistance zone.
As you see it was strong enough to stop buyers not only earlier this month, but also many times in August, which suggests that as long as there is no successful breakout above it higher values of USD/CHF are not likely to be seen.
Nevertheless, when we take into account the fact that the buy signal re-generated by the Stochastic Oscillator remains in the cards, it seems that currency bulls will try to push the pair higher in the very near future. At this point, however, it is worth keeping in mind that slightly above the orange area the buyers will have to face another strong resistance zone (marked with yellow), which keeps gains in check since mid-July.
Therefore, in our opinion, another significant move to the upside will be more likely and reliable id we see USD/CHF above the yellow resistance zone. Until this time, another reversal from this area should not surprise us – especially if the daily indicators generate sell signals in the coming week.
Want free follow-ups to the above article and details not available to 99%+ investors? Sign up to our free newsletter today!
Author

Paul Rejczak
Sunshine Profits
Paul Rejczak is a stock market strategist who has been known for the quality of his technical and fundamental analysis since the late nineties.


